|
|
|
|
|
One indication of a “complete” neighborhood is its proximity to key financial and retail services. Walkable access to a range of businesses such as banks, hardware stores, laundromats, and restaurants can improve a neighborhood’s livability and make it easier for residents to meet their daily needs. Living in close proximity to these amenities can also encourage transit use, walking, and biking, which reduces traffic congestion and promotes better health.
This map series shows proximity to financial and key retail services, first as separate maps and then in two composite maps.

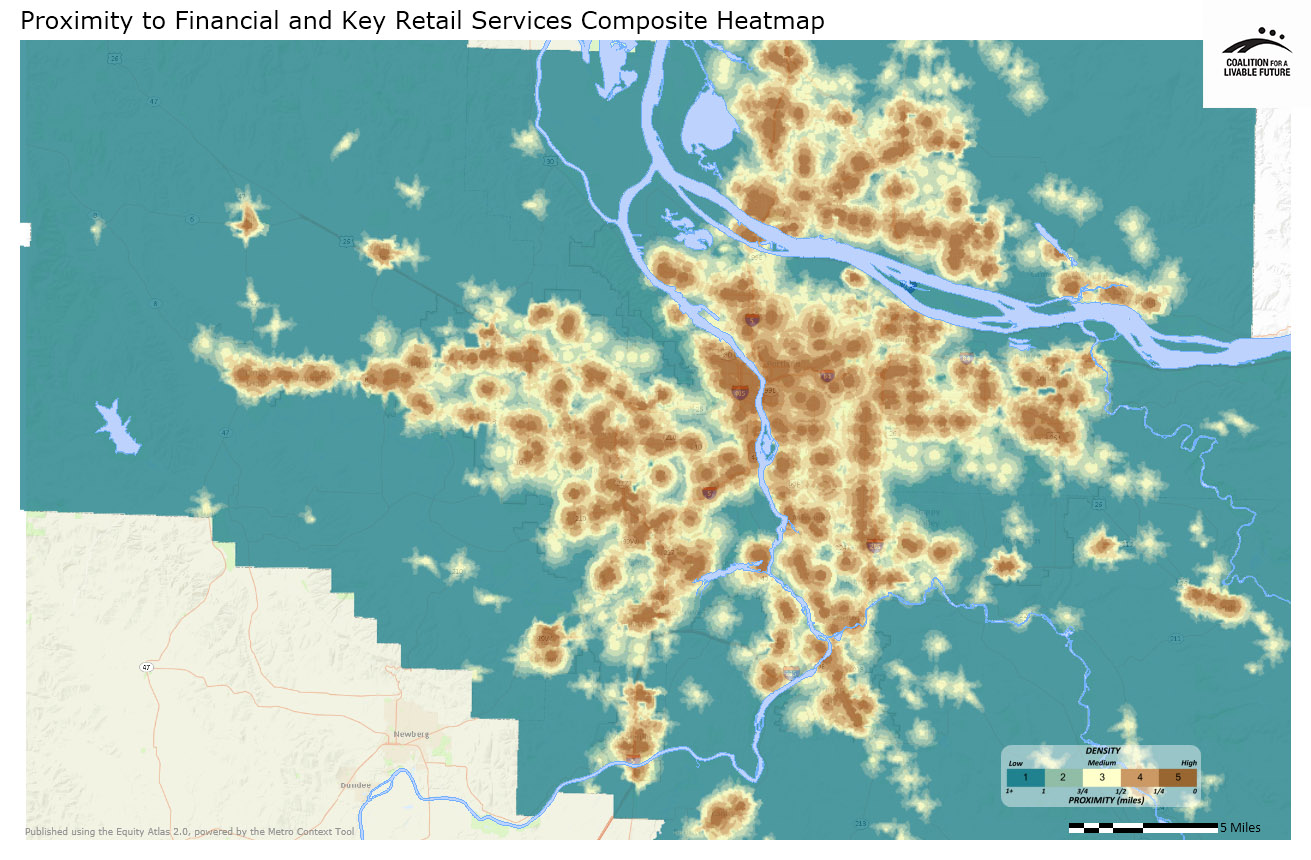
The Proximity to Financial and Key Retail Services Composite map indicates that proximity to retail and financial services tends to be highest in the neighborhoods close to downtown Portland, as well as in neighborhoods in Vancouver, Lake Oswego, Beaverton, Milwaukie, and several other cities across the region.
The Atlas mapping tool can be used to assign a proximity score to every neighborhood in the region based on the average proximity of every block in the neighborhood to a particular resource. A score of “5” indicates proximities within ¼ mile, while a score of “1” or below indicates proximities greater than 1 mile. The ten neighborhoods across the region with the highest proximity to retail and financial services include seven Portland neighborhoods, two Lake Oswego neighborhoods, and one Vancouver neighborhood:
|
Neighborhood |
Location |
Proximity to Financial Services |
Proximity to Key Retail Services |
|---|---|---|---|
|
Portland |
5.00 |
5.00 |
|
|
Hazelwood/Mill Park |
Portland |
5.00 |
5.00 |
|
Lloyd District/Sullivan’s Gulch |
Portland |
5.00 |
5.00 |
|
Multnomah County Unclaimed #6 (west of the Hollywood District) |
Portland |
5.00 |
5.00 |
|
Hollywood |
Portland |
4.87 |
4.94 |
|
Old Town |
Portland |
4.93 |
4.93 |
|
Sullivan’s Gulch |
Portland |
4.72 |
4.98 |
|
Waluga |
Lake Oswego |
4.93 |
4.74 |
|
Arnada |
Vancouver |
4.58 |
4.99 |
|
Foothills |
Lake Oswego |
4.59 |
4.97 |
Among the 50 neighborhoods with the highest proximities to financial and retail services, thirty-three are in Portland, two are in Beaverton, one is in Gresham, four are in Lake Oswego, two are in Milwaukie, and eight are in Vancouver. Examples of high-scoring neighborhoods outside of Portland include Gresham City Central, Milwaukie Business Industrial, Central Beaverton, Sandy, Estacada, and Vancouver’s Northcrest and Cimarron neighborhoods.
Not surprisingly, almost all of the neighborhoods with the lowest proximity to key retail and financial services are located in unincorporated areas of the four-county region.
These patterns suggest a clear, and predictable, relationship between proximity to retail and financial services and urbanization. However, the relatively high proximity to retail and financial services in places like Sandy and Estacada indicates that it is possible to have many of the features of a “complete neighborhood” in a wide range of geographic areas.
It is important to note that even those residents living in neighborhoods that are rated as having high proximity to retail and financial services may still not be able to meet all of their needs in their local neighborhood. For example, the index of key retail services that was used for the map does not include information on the cultural appropriateness or costs of those services. For this reason, the proximity scores should be viewed more as a measure of the vibrancy of each neighborhood’s overall retail climate than a reflection of whether all residents can meet their needs in the neighborhood.
This map displays proximity to various financial services defined using NAICS codes (North American Industrial Classification System). It includes businesses categorized as commercial banking, savings institutions, and credit unions. These data do not capture the full range of financial services across the region but instead focus on those for which comprehensive data are publicly available.
Data Source: ESRI Business Analyst (2010)
This map displays proximity to various retail services defined using NAICS codes (North American Industrial Classification System). It includes businesses categorized as general automotive repair, barber and beauty shops, beauty salons, sporting goods stores, laundries and dry cleaners, dry cleaning and laundry services, fitness and recreational sports centers, hardware stores, pharmacies and drug stores, motion picture theaters, and video tape and disk rental.
These data do not capture the full range of retail businesses across the region but instead focus on those for which comprehensive data are publicly available.
Because the definition of what constitutes a Key Retail Service is subjective, the Atlas relies on the definition developed by the San Francisco Department of Public Health for the Healthy Development Measurement Tool, a highly regarded indicators project whose index is based on extensive research.
Data Source: ESRI Business Analyst (2010)
This map combines the proximity scores from the Proximity to Financial Services and the Proximity to Key Retail Services maps to create a composite heatmap.
Data Source: ESRI Business Analyst (2010)
This map uses the same underlying data as the Proximity to Financial and Key Retail Services Heatmap, but instead of showing the data as a heatmap it aggregates the data by neighborhood. The darker the neighborhood, the higher its proximity score.
Data Source: ESRI Business Analyst (2010)
*Some neighborhood boundaries overlap. The Atlas refers to the areas within the overlapping boundaries by the names of both neighborhoods.