|
|
|
|
|
Understanding the distribution of home owners, renters, and vacant homes across the region provides important context for our analysis of regional equity issues. Home ownership is a key source of household asset building, and access to homeownership is frequently viewed as an indicator of economic opportunity. Higher home ownership rates and lower rates of vacant homes may also correspond with increased levels of neighborhood stability. Rental housing is a key resource for emerging or transitioning households, as well as lower-income households.
The maps in this series show the distribution of different types of housing, by tenure, across the region. Each map shows the density per acre of housing units (all residential addresses that the U.S. Census tracks) that are either (a) rented, (b) owner-occupied (with or without a mortgage), or (c) vacant (i.e. the census takers could not locate a resident).

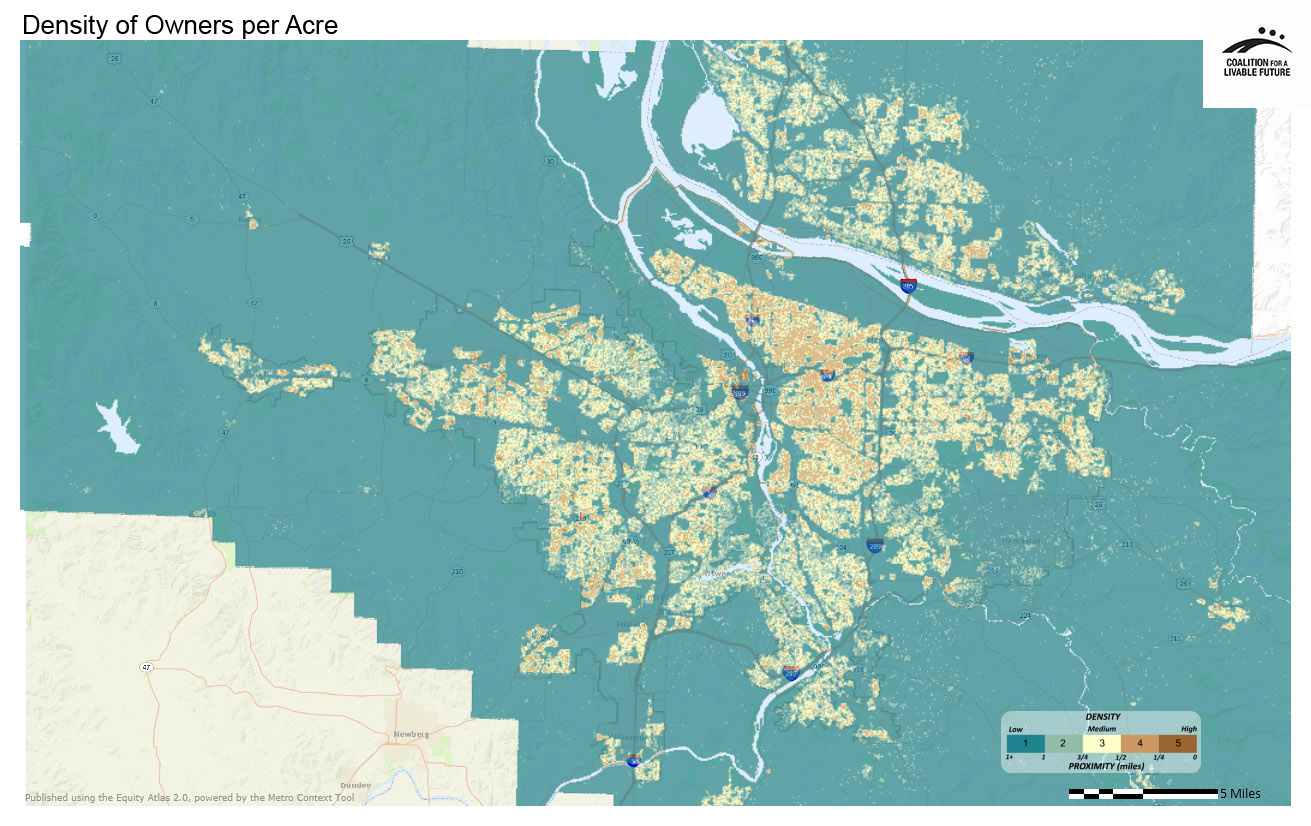
Collectively, these three maps depict the geographic distribution of housing units throughout the region. Looking at the maps one after another allows the viewer to see regional patterns of where rented, owner-occupied and vacant units are located relative to one another. The map Density of Owners per Acre shows that owner-occupied units are dispersed throughout the region in varying degrees of density. In contrast, the map Density of Renters per Acre shows that rental housing is densely clustered in a few locations. Finally, the map Vacant Units per Acre shows that, while vacant housing units are located throughout the region, the pattern is dominated by one major cluster and a few smaller clusters. (Note: Because the density classification schemes used for each map are relative rather than absolute, a dense area on one map does not necessarily represent the same number of housing units as a dense area on another map.)
In the Density of Renters per Acre map, the two largest dense clusters of rental housing are found in close-in Portland neighborhoods. One is on the west side and is located in the Goose Hollow, Northwest, Hillside District, Pearl and downtown Portland neighborhoods. The other is found on the east side and is located in the Buckman and Kearns neighborhoods. In Portland, other smaller clusters are found in the Reed College area, and in neighborhoods near the I-84 corridor. In east Multnomah County, dense clusters of rental housing are found along the light rail line and in the Gresham-Mount Hood neighborhood area.
In Washington County, small dense clusters of rental housing are found along local transportation corridors such as 99W, in downtown neighborhoods of Beaverton and Hillsboro, and in a few other locations.
Clackamas County has a pattern similar to that of Washington County, with small dense clusters appearing along 99E and I-205, in Milwaukie and the adjacent unincorporated area, and in a few other locations.
In Clark County, small dense clusters of rental housing are located along the Mill Plain Boulevard, I-5, I-205 and State Road 500 corridors, in the Harney Heights neighborhood, and in a few other locations.
The Density of Owners per Acre map shows owner-occupied units dispersed throughout the region. One of the most noticeable clusters is the pattern of denser urban single family housing in Portland’s older inner east and west side neighborhoods. But there are smaller dense clusters scattered in locations throughout the region’s four counties.
The Density of Vacant Units per Acre map shows that vacancies are concentrated in a large cluster in Portland in the west side neighborhoods of Goose Hollow, Northwest, Hillside District, Pearl and downtown Portland, where the region’s largest cluster of rental housing is found. Other smaller clusters of vacant units are found in the Cedar Hills/Cedar Mills and South Beaverton areas in Washington County, and in neighborhoods along State Road 500 in Clark County—again, where dense clusters of rental housing are found.
This map shows the density per acre of persons indicating that they are renters in the 2010 Census.
Data Source: U.S. Census, 2010 (H4 Tenure); Universe = Total Housing Units
This map shows the density per acre of persons indicating that they are homeowners in the 2010 Census.
Data Source: U.S. Census, 2010 (H4 Tenure); Universe = Total Housing Units
This map shows the density per acre of vacant units. These were defined as a valid address recorded with the U.S. Census Bureau that has no occupant.
Data Source: U.S. Census, 2010 (H4 Tenure); Universe = Total Housing Units
Note:
The density classification schemes between the various housing tenure maps are relative rather than absolute (or standardized). For instance, an area that receives a density rating of “5” on the Renters per Acre map does not necessarily equate to the same number of households as an area that receives a rating of “5” on the Owners per Acre heatmap. For this reason, when analyzing the maps using the Atlas online mapping tool, the density scores should only be used for making comparisons between different geographic areas on the same map, not for making comparisons between different maps.