|
|
|
|
|
Understanding the age distribution of the region’s population should be part of any analysis of regional equity. People’s priorities and needs are determined in part by their age and stage of life. Age also plays a role in defining levels of vulnerability; two of the populations considered to be the most vulnerable – children and seniors – are defined that way because of their age.
The Atlas mapping tool includes maps showing the full spectrum of age categories, including young and school-age children (under age 5, ages 5-17, and 0-17), adults (18-44 and 45-64) and seniors (65 and over). The maps in this series focus on the most vulnerable of the age categories: children, youth and seniors. The series includes maps showing (a) the density per acre of children under age 5, (b) the census tracts with above the regional average percent of youth ages 0-17, (c) the density per acre of seniors age 65 and over, and (d) the census tracts with above the regional average percent of seniors.
These maps provide useful context for many of the Atlas’ other maps. For example, maps on access to parks and recreational facilities can be more effectively interpreted when viewed in conjunction with maps showing the density of youth in each of the region’s neighborhoods. Similarly, maps on the density of accessible housing are more meaningful when analyzed in conjunction with maps showing the density of the senior population.

The Population Under Age 5 (Density by Acre) map indicates that although children under age 5 live throughout the region, small areas with higher densities of this population occur in Clark County, north Portland, east Multnomah County, Battleground, Yacolt (Clark County), Vancouver and in several locations in Washington County. Portland’s west side and inner east side neighborhoods, Lake Oswego and West Linn have relatively few areas with high concentrations of young children.
Across the region, 23.68% of all residents are youth (ages 0-17). The overlay map entitled Above Regional Average Percent Youth (Ages 0-17) highlights the census tracts where the percent of residents who are under age 18 is above the regional average. The map looks like a donut; the census tracts with percentages of youth that are above the regional average are primarily located in areas outside the urban center of the region. Only a few census tracts within the I-205 loop have higher than average concentrations of youth. In Vancouver, almost all census tracts along the Columbia River have lower than average percentages of youth. From an equity perspective, we can compare this map with the Atlas maps showing the distribution of resources and opportunities that are most relevant to youth, to assess how well the locations of those resources align with the places where youth are concentrated.
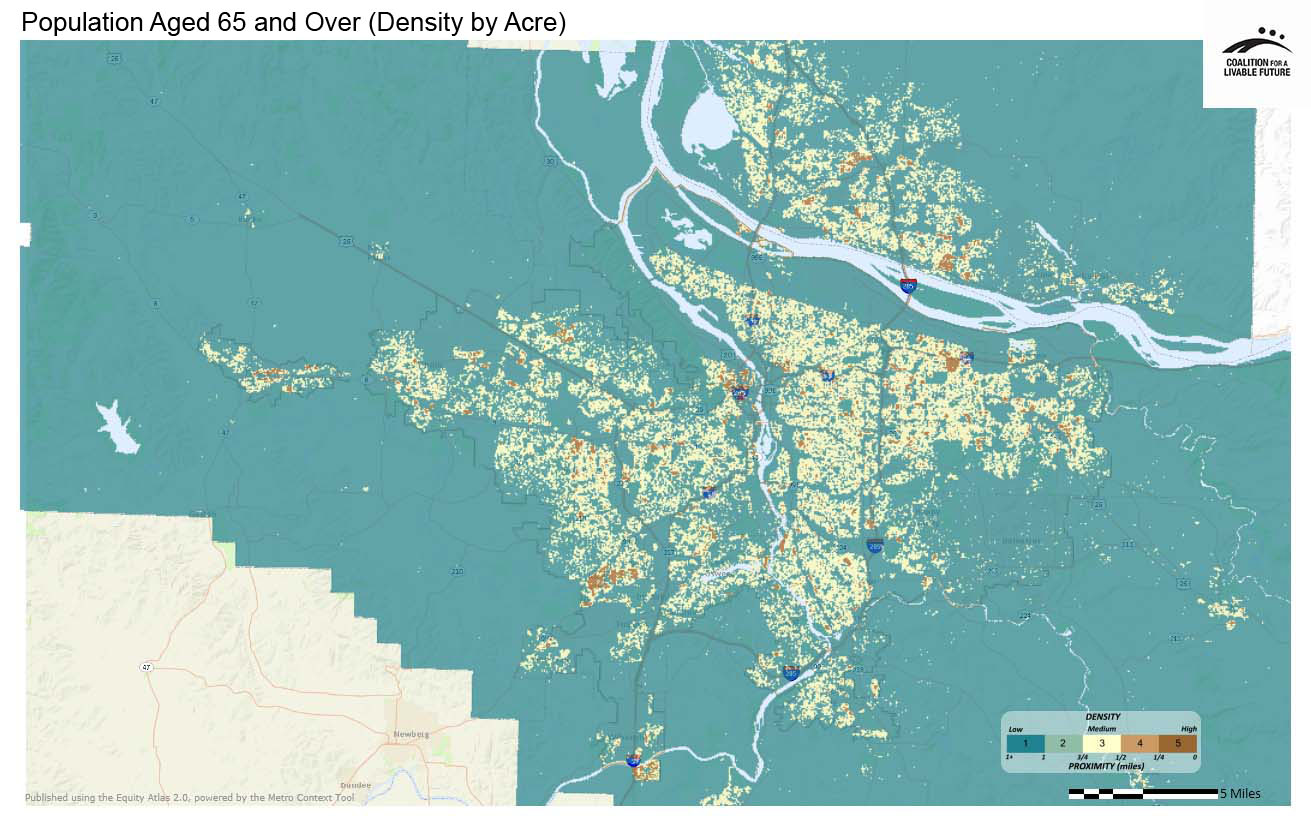
Like young children, older adults (age 65 and older) live throughout the region. The map Population Aged 65 and Over (Density by Acre) shows that there are higher densities of older adults in King City, southern Tigard, the Pearl District, Goose Hollow, Hillside/Northwest District, downtown Portland and in an area of outer northeast Portland south of I-84 and just inside the city limits.
Across the region, 10.76% of all residents are age 65 or older. The Above Regional Average Percent Seniors (Ages 65+) map highlights the census tracts where the percent of residents who are seniors is above the regional average. The most striking pattern in the map is that almost all of Clackamas County’s census tracts have higher than average percentages of older adults. In Washington County, many census tracts in the unincorporated areas have higher than average percentages of seniors. In Multnomah County, census tracts with higher than average percentages of older adults occur throughout the county. In Clark County, census tracts with higher than average percentages of older adults occur along the Columbia River and are also scattered throughout the rest of the county.
From an equity perspective, these maps are useful in planning for amenities, facilities and services that meet the needs of residents at different stages of life. While older adults and young children have many needs that are different, they do share several in common. Very old adults (age 80 and older) and very young children (younger than age 5) are less likely to be able to navigate independently than other age groups. Thus, the physical conditions (e.g. air quality) in their immediate environment are very important to their health and well-being because they spend so much time there. Similarly, safe and accessible walking routes are important to both child caregivers with strollers and older adults with mobility impairments.
This map shows the density (persons per acre) of the population under age 5.
Data Source: U.S. Census 2010 (P12 Sex by Age); Universe = Total Population
This map shows census tracts with above the regional average percent youth, defined as populations between 0 and 17 years of age.
Data Source: U.S. Census 2010 (P12 Sex by Age); Universe = Total Population
This map shows the density (persons per acre) of the population aged 65 and over.
Data Source: U.S. Census 2010 (P12 Sex by Age); Universe = Total Population
This map shows census tracts with above the regional average percent populations aged 65 and over.
Data Source: U.S. Census 2010
Note:
When using the Atlas online mapping tool to analyze age densities, it is important to remember that the density measurements in the tool are relative rather than absolute (or standardized). For instance, a rating of “5” on the Population Under Age 5 heatmap might not necessarily represent the same number or percentage of people as a rating of “5” on the Population Aged 65 and Over heatmap. What this means is that you can use the statistics to compare the relative densities of the population under age 5 across different geographic areas, but you cannot use the "1" to "5" scores to compare the actual numbers of children with the actual numbers of seniors in a geographic area.