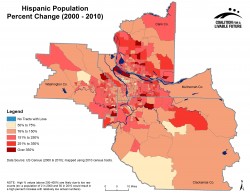
Maps provide a unique and powerful way to examine community conditions:
- Maps enable the effective use of complex information by presenting data and relationships visually, rather than through dense text or tables.
- Maps provide the entire picture of regional equity while at the same time enabling us to zoom in to see specific areas in greater detail.
- Maps help illuminate inequities by showing patterns and trends.
- Maps allow information to be layered, and for each layer to highlight different issues.
But there are also limitations in using maps to analyze equity:
| CLF's Regional Equity Atlas project includes other components to provide insights into equity issues that aren't captured in the maps. Click here for examples. |
- Maps frame issues geographically and spatially, but some equity issues aren’t geographic in nature and don’t lend themselves to being mapped.
- Maps are limited by the available data. For many critical issues that are relevant to equity, high-quality data are not available or are not in a format that can be mapped.
- Maps implicitly define issues of access in terms of physical proximity to resources, but access is also affected by other factors, such as the affordability and cultural appropriateness of the resources.

