Heatmaps
In the Regional Equity Atlas 2.0, heatmaps are used for mapping indicators whose source data are at the highest spatial resolution available. Heatmaps display data as raster cells (or pixels). In the Equity Atlas 2.0, the raster cells are based on units of 264 square feet, which is approximately a square city block. Each cell of the heatmap is assigned a value ranging from one to five, with five representing the highest level of access and one representing the lowest level of access to the indicator being mapped.
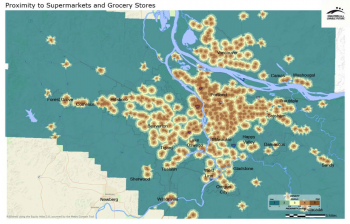
 Two types of heatmaps are available in the Equity Atlas 2.0 – proximity and density maps.Proximity maps are created from precisely located point data and use a one to five scale to indicate distance from a set of points. Density maps indicate “hotspots” where there are high concentrations of a particular population or resource.
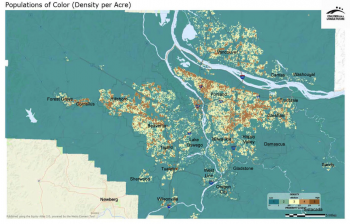
For example, the map on the top right shows proximity to supermarkets and grocery stores. The darkest brown areas have the greatest proximities and the blue areas have the lowest proximities. The map on the left shows density of populations of color. The darkest brown areas have the highest densities and the blue areas have the lowest densities.
Shapes
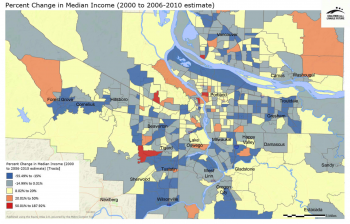
Shapes are used in the Equity Atlas 2.0 for mapping indicators that are created from vector data. The data are aggregated or averaged into pre-set geographic units such as census blocks groups, census tracts, or zip codes. The data are displayed using a choropleth map – a thematic map that uses a single color palette to display the range of data values (a light tint signifies low values, while a dark tint shows high values). Change-over-time maps typically use a blue to red color scheme, where blues indicate negative growth and reds indicate positive growth.
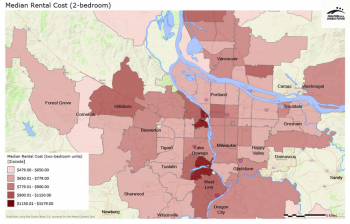
For example, the map on the left shows median rental cost by zip code. The darkest reds indicate the areas with the highest median rental costs, and the lightest reds indicate the areas with the lowest costs. The map on the right shows percent change in median income. The blue areas had a decline in median income while the red areas had increases in median income.
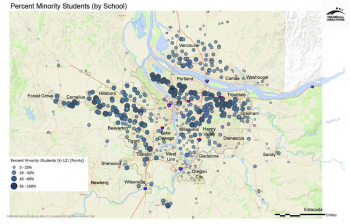
Shape indicators can also be displayed as points that are placed at specific locations (usually through geocoding street addresses). Points can be displayed using different types of symbology. The example below shows the percent of minority students by school using both a “choropleth” style that uses a light-to-dark color palette as well graduated sizes of points.This dual symbology makes it a bit easier to distinguish variation due to the large number of points.