
Are the data available in a consistent format across the equity atlas’s entire geographic scope?
The data you use for your equity atlas must be available in a consistent format for the entire geographic area that you intend to map. Otherwise, the equity atlas maps will not provide meaningful information on patterns. For example, in compiling data for the Regional Equity Atlas 2.0, CLF found that the City of Portland had dedicated significant resources to gather and compile comprehensive data on sources of neighborhood “greening” (e.g. tree canopy, vegetation, green streets, eco-roofs) within the city’s boundaries. However, no other jurisdiction in the four-county metro region had gathered similar data, making it impossible to include this indicator in the Regional Equity Atlas 2.0. (CLF ultimately decided to add a Portland-only map of the indicator in an effort to inspire other jurisdictions to collect these data.)
In some cases, data may be available for the entire geographic area that you want to map, but the data may not be uniformly measured. In this case, mapping the data could produce misleading information. For example, data on property crimes is collected by local law enforcement agencies within each jurisdiction in the four-county Portland metro area. But each jurisdiction uses its own definitions, measurement tools, and reporting formats for these data. In light of the lack of consistency across the different jurisdictions’ data, CLF determined it could not include the data in the Regional Equity Atlas 2.0.
Are the data available at the desired geographic scale?
Equity atlas maps should present data at a geographic scale that can meaningfully inform an analysis of local patterns. It is relatively easy to find data aggregated to large geographic units, such as cities and counties. But data mapped at this level do not capture local variations, making it difficult to target policies or programs to the needs of specific localities or to analyze the intersections between demographic patterns and access to opportunity. When assessing whether a particular data source is appropriate for inclusion in the equity atlas, it is important to determine whether the data’s spatial resolution will support its intended use.
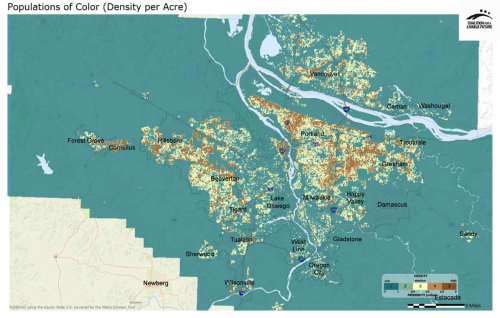
 The following two maps from CLF’s Regional Equity Atlas 2.0 illustrate this issue.
The Density of Populations of Color map is based on 2010 U.S. Census data, which is gathered at a high level of spatial resolution from a survey of the entire population. This resolution provides accurate and spatially explicit data. The map shows where higher densities of people of color reside in relationship to the region as a whole. It also provides detailed information on neighborhood-level demographic patterns, which can be overlaid with other maps to provide insights into disparities in access to opportunity. Viewing information at this level of spatial resolution supports strategic decision-making that targets policies and programs where they are needed most. The map can also show the fine details of demographic change over time.
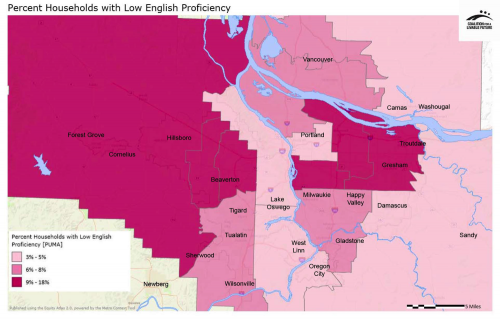
The Percent Households with Low English Proficiency map is based on data collected by the American Community Survey and represents a statistical sampling of the population. Due to issues with high margins of error at finer spatial resolutions, these data are only accurate when mapped at the relatively coarse PUMA (Public Use Microdata Area -- a census statistical unit) level. While the map shows a general regional pattern, it cannot be used to analyze neighborhood-level patterns in access to opportunities or to make localized policy or programmatic decisions.
Adapted from Besser, Diane T. (April, 2014). “What Does ‘Equity’ Look Like? A Synthesis of Equity Policy, Administration and Planning in the Portland, Oregon, Metropolitan Area”. Report prepared for the Institute for Metropolitan Studies, Portland State University, Portland, OR (unpublished).