
Equity atlases can inform policy, planning, and investment decisions by providing objective and visually compelling data on an area’s demographics and geography of opportunity. This page illustrates some of the ways that CLF’s Regional Equity Atlas 2.0 has been used to inform decision-making and spur policy change.
Identify areas of highest need
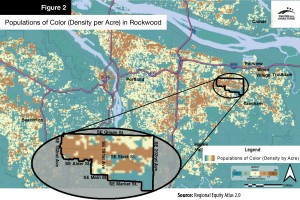
Ecumenical Ministries of Oregon (EMO) conducted a food security assessment in Rockwood, one of the most culturally diverse and lowest income neighborhoods in the Portland metro region. EMO used the Equity Atlas 2.0 data to compare Rockwood’s demographics (median income, poverty level, populations of color) and access to opportunity (food, sidewalks, public transit) to the rest of the region. The results showed Rockwood having among the lowest levels of access across all measurements and among the highest percentages of people in poverty and people of color. The assessment provided EMO with a data-driven advocacy tool that will inform policy- makers of these disparities and highlight the critical need to prioritize service investment in the neighborhood.
Inform an equity impact assessment
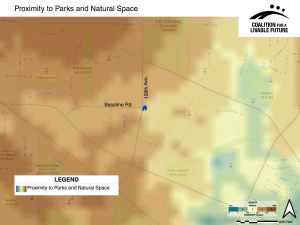
The Washington County Office of Community Development is working to incorporate an equity assessment into their planning and decision-making about where to locate future housing developments. To help identify the criteria that should be included in this equity assessment, County staff engaged developers and community members in a scenario exercise using the Equity Atlas 2.0 maps. County staff presented Equity Atlas 2.0 maps of a potential site within Washington County that could be used for the development of affordable housing. The maps showed the site's access to transit, educational facilities, healthy food options, and parks. The maps created a framework that allowed developers and community members to analyze the criteria that should be used for assessing the benefits and drawbacks of specific sites from an equity perspective. Based on the discussion, the County staff gleaned the important equity issues related to housing developments that should be included in future equity assessments.
Identify vulnerable communities
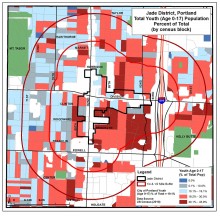
CLF worked with the Asian Pacific American Network of Oregon (APANO) to use the Equity Atlas 2.0 data to analyze the demographics of the Jade District, an area in Portland where many Asian-Pacific Islander community members live. APANO used the data to highlight the area’s needs to policy makers and to prioritize their future services to the neighborhood. For example, the maps showed that a large percentage of the residents in the district are under age 18. This information has helped to inform APANO’s planning for offering programs such as childcare services and education centers in the neighborhood.
Analyze potential sites for investment
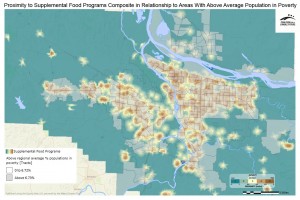
The Oregon Food Bank (OFB) has utilized the Equity Atlas 2.0 maps and data to determine the areas in the metro area with the greatest levels of need for supplemental food and nutrition services. Their analysis has focused on shifts in poverty over time, current poverty rates, and access to other services and opportunities. In conjunction with internal agency data, they have used the Equity Atlas 2.0 to decide where new partner agencies and direct service programs such as Harvest Share and Community Basket should be located.
OFB also worked with CLF to sponsor a workshop that engaged a broad range of stakeholders from nonprofit and government agencies across the region in examining the Equity Atlas 2.0 maps and data related to poverty and food access. The workshop provided a forum for a cross-sector discussion about the implications of the maps from a policy perspective and the potential strategies that should be used to address the disparities highlighted on the maps.
Track performance measures
Metro, the metropolitan planning organization for the Portland region, is undergoing a comprehensive review of their policies, programs, and plans to assess the overall impacts of their work on regional equity outcomes such as access to parks and transportation options. Once the equity impact assessment is completed, Metro will use the Equity Atlas 2.0 to establish baseline measures for various equity indicators. The baseline measures will provide Metro with a snapshot of the current equity conditions in the region which will help to inform Metro’s decisions in establishing five-year goals to impact these baseline conditions. Metro will then re-run the Equity Atlas 2.0 baseline measures every five years to evaluate the agency’s performance and determine whether it has met established goals.