Translating the equity atlas findings in ways that will spark policy change requires a range of strategies that will meet the distinct interests and goals of different types of stakeholders. There is no one size fits all approach. The examples below illustrate different ways that CLF has worked with stakeholders to use the Regional Equity Atlas 2.0 to move from data to action. In each case, CLF met with the stakeholder organization to identify its particular interests and goals and then developed a customized approach for sharing the Equity Atlas 2.0 maps and data with the organization’s constituents and facilitating a process for using the Equity Atlas 2.0 findings to guide the organization’s decisions.
Use the Maps to Tell a Story
The Multnomah County Department of County Human Services (DCHS) was interested in using the Regional Equity Atlas 2.0 to frame their program planning and prioritization. CLF worked with department leaders to use the Equity Atlas 2.0 maps and data to tell a story about poverty conditions in the county, focusing on the issues and geographic areas of greatest interest to DCHS staff. The information was shared at a day-long planning retreat that included a CLF-facilitated discussion about how the information should inform DCHS’s work.
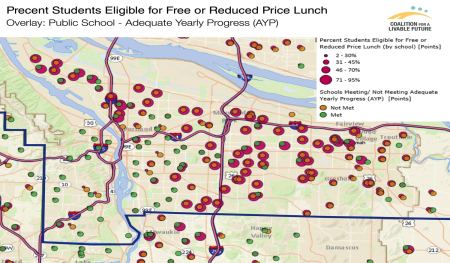
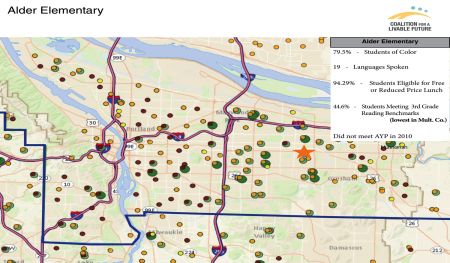 For example, many of DCHS’s services for low-income families are provided through a network of programs located in public schools. CLF presented a series of slides showing how the demographics of the county’s public schools correlate with educational achievement outcomes (as illustrated by the map on the right). To make this information more tangible, and to show how DCHS can use the information to inform its decision making, CLF then highlighted the conditions in a single school, Alder Elementary, which is well known to DCHS staff and exemplifies many of the disparities experienced in low-income schools throughout the county. This example (map on the left) enabled DCHS staff to apply the Equity Atlas 2.0 data to a concrete situation and then think about how to use the data more broadly to inform their prioritization of services for low- income children and families countywide.
Put a Face on the Data
![]() CLF’s Equity Stories project gathered videos, photographs, quotes, and personal narratives from people across the region who are impacted by the disparities shown in the Equity Atlas 2.0 maps. Advocacy organizations have used these stories to put a human face on local conditions, and to create a more compelling case for policy change.
CLF’s Equity Stories project gathered videos, photographs, quotes, and personal narratives from people across the region who are impacted by the disparities shown in the Equity Atlas 2.0 maps. Advocacy organizations have used these stories to put a human face on local conditions, and to create a more compelling case for policy change.
For example, CLF partnered with the Community Alliance of Tenants (CAT), a grassroots tenants-rights organization, to create a video that captures the experiences of low-income refugees who are living in severely sub-standard housing that subjects the tenants to unhealthy living conditions. CAT is using the videos in support of a campaign to advocate for increased funding and regulations to bring rental units up to code so that low-income renters are not forced to live in substandard housing that makes their families sick.
Combine Indicators into Composite Maps
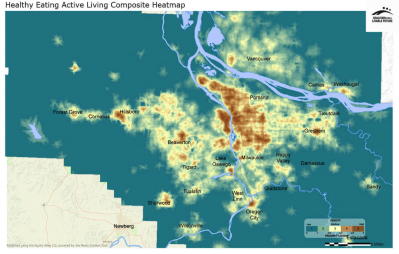 Oregon Public Health Institute (OPHI) leads the Healthy Eating Active Living (HEAL) Cities campaign, which strives to support civic leaders in creating healthy communities that promote opportunities for physical activity and that are in close reach to healthy foods and public transit.
To assist civic leaders in understanding the HEAL opportunities within the Portland metropolitan region, CLF provided OPHI with a composite HEAL map that combines the Equity Atlas 2.0 indicators showing proximities to fresh food, full service grocery stores, parks, natural areas, active transit, and recreational facilities. The map provides a powerful visual depiction of the areas in the region that have high proximities to HEAL factors and the areas that are deficient in these factors. OPHI has used the map to educate civic leaders about the communities in their jurisdictions with the greatest need for strategic investments in HEAL opportunities.
 Use Geographic Overlays to Align the Maps with the Decision-Making Process
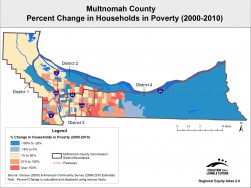
CLF supported the development of a comprehensive report on poverty in Multnomah County, drawing heavily on the Equity Atlas 2.0 data and maps. The report was commissioned by Multnomah County government to provide background information to support a planning process to address inequality in the county.
To lay the groundwork for County Commissioner support for a broad countywide anti-poverty initiative, CLF created a version of all of the maps in the report that show the data overlaid with County Commissioner district boundaries. The maps were used in briefings with each of the Commissioners prior to the report’s release. The briefings helped Commissioners to understand poverty conditions in their districts and to see the relevance of the report’s findings to their own constituents.
Find Creative Ways to Engage Audiences with the Data
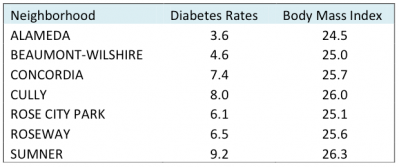 Community organizations working to create a new city park in Portland’s low-income Cully neighborhood used the Equity Atlas 2.0 data to create a game that engaged community members in a discussion of the relationship between park access and health outcomes. Community members were given a list of neighborhoods bordering the location of the new park, along with a list of diabetes and obesity rates for each of the neighborhoods. Participants then had to figure out which rates belonged to which neighborhoods. The game got the community members actively engaged in exploring the data, and sparked a lively discussion about the variations in disease rates across the neighborhoods and how this relates to variations in socioeconomic and built environment factors.
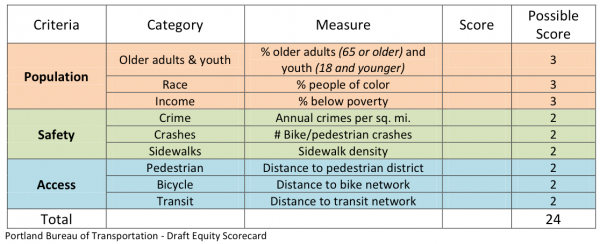
Develop Scorecards or Other Tools to Assist with Prioritization
To assist in incorporating equity considerations into its planning and implementation of street lighting upgrades, Portland Bureau of Transportation (PBOT) used the Equity Atlas 2.0 to create an equity scorecard. The scorecard outlines the elements that will determine whether a community should receive priority status for receiving the lighting upgrades. PBOT will use data from the Equity Atlas 2.0 to fill in the scorecard for each of the city’s neighborhoods to determine the sequence of when each neighborhood will receive its upgrade during the two-year upgrade period.