Minority Home Ownership Gap
Home ownership is a key source of asset building for many American households. Owning a home can also contribute to greater housing stability and an improved quality of life. The ability to purchase a home can be affected by household income, credit history and access to money for a down payment. While it is illegal for sellers and lenders to discriminate against potential buyers based on race, the legacy of historic and institutionalized racial discrimination continues to impact current home ownership rates. Familiarity with the financial services system and the necessary preparations to qualify for a mortgage may also play a role; recent immigrants, in particular, may find it difficult to navigate through the complexities of financing a home purchase.
The combined impact of these factors has historically contributed to a home ownership gap between whites and populations of color. This map series shows how the home ownership gap varies geographically and how the gap relates to patterns of income and race. It includes maps of (a) the minority home ownership gap by census block group; (b) the minority home ownership gap in relationship to the percentage of minority students by school; and (c) the minority home ownership gap in relationship to schools with 75% or more of students eligible for free or reduced price lunch. The second and third maps use school demographic data as a proxy for neighborhood demographics because the school data are mapped in a format that can be easily layered with the minority home ownership map while maintaining the visual clarity of the data.


What the Maps Tell Us: Initial Findings
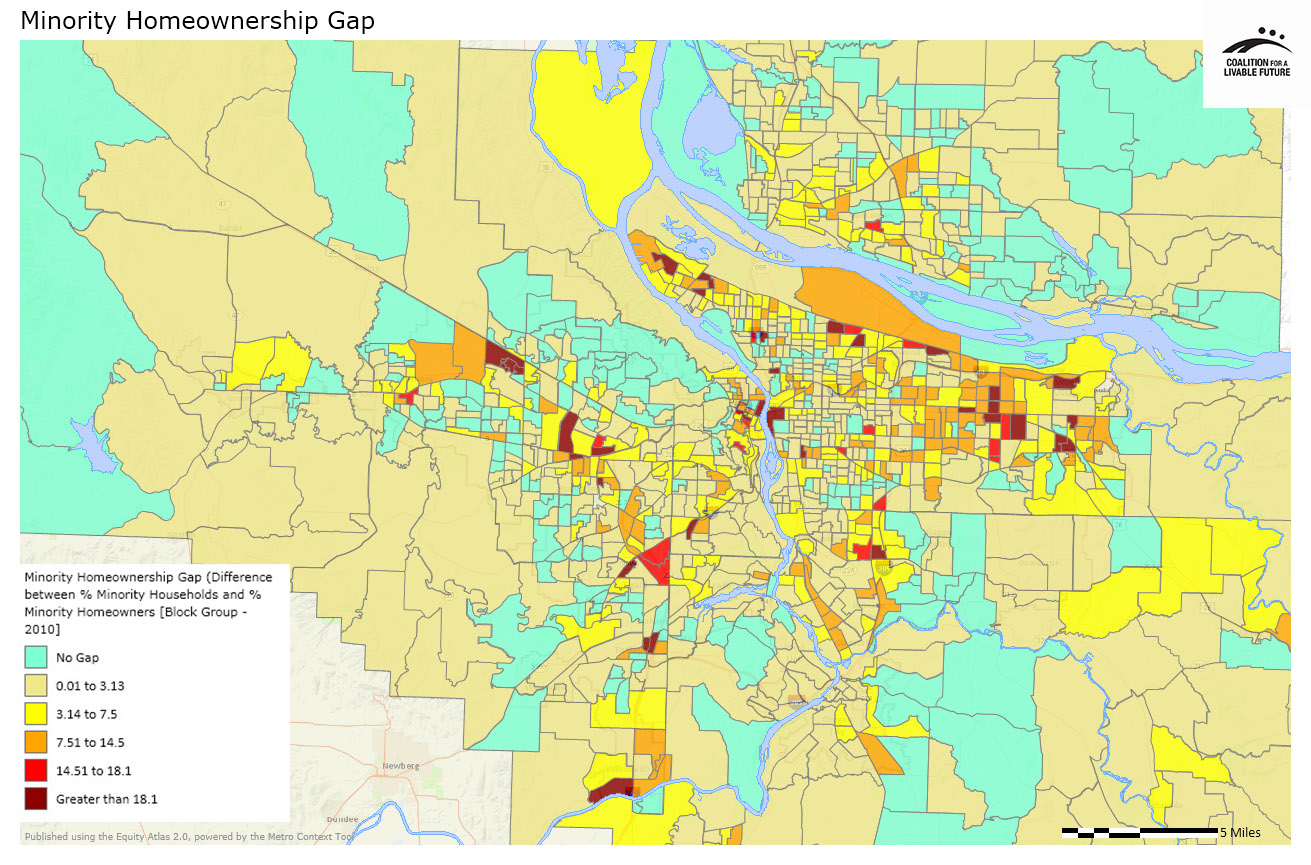
The Minority Home Ownership Gap map reflects the disparity in home ownership rates between whites and minorities (defined as anyone except non-Hispanic whites). The areas in blue on the map have no home ownership gap, meaning that there is no statistical difference between the percentage of households that are minorities and the percentage of home owners that are minorities in those areas. Positive numbers (beige to red) indicate a minority home ownership gap, meaning that the percentage of minority home owners is lower than the percentage of minority households. The larger the number (i.e. the redder the color), the greater the gap.
The method of calculating the minority home ownership gap results in a tendency for larger minority home ownership gap numbers to occur in areas that have larger overall minority populations. This means that some census block groups that appear on the map as having a low minority home ownership gap do not necessarily offer robust home ownership opportunities for minority populations; rather they have very low overall minority populations. For this reason, any analysis of the map should include an analysis of the size of the minority population in that particular block group before drawing any conclusions.
The map indicates that there are significant areas of our region where populations of color own homes at lower rates than whites. These areas are spread across the region, with gaps ranging from .01% to greater than 18%. Five neighborhoods contain more than two census block groups with a minority home ownership gap higher than 14.5. These areas include the CPO Sommerset-West Elmonica neighborhood in Washington County, Portland’s Cully and downtown neighborhoods, and Gresham’s Rockwood and Centennial neighborhoods.
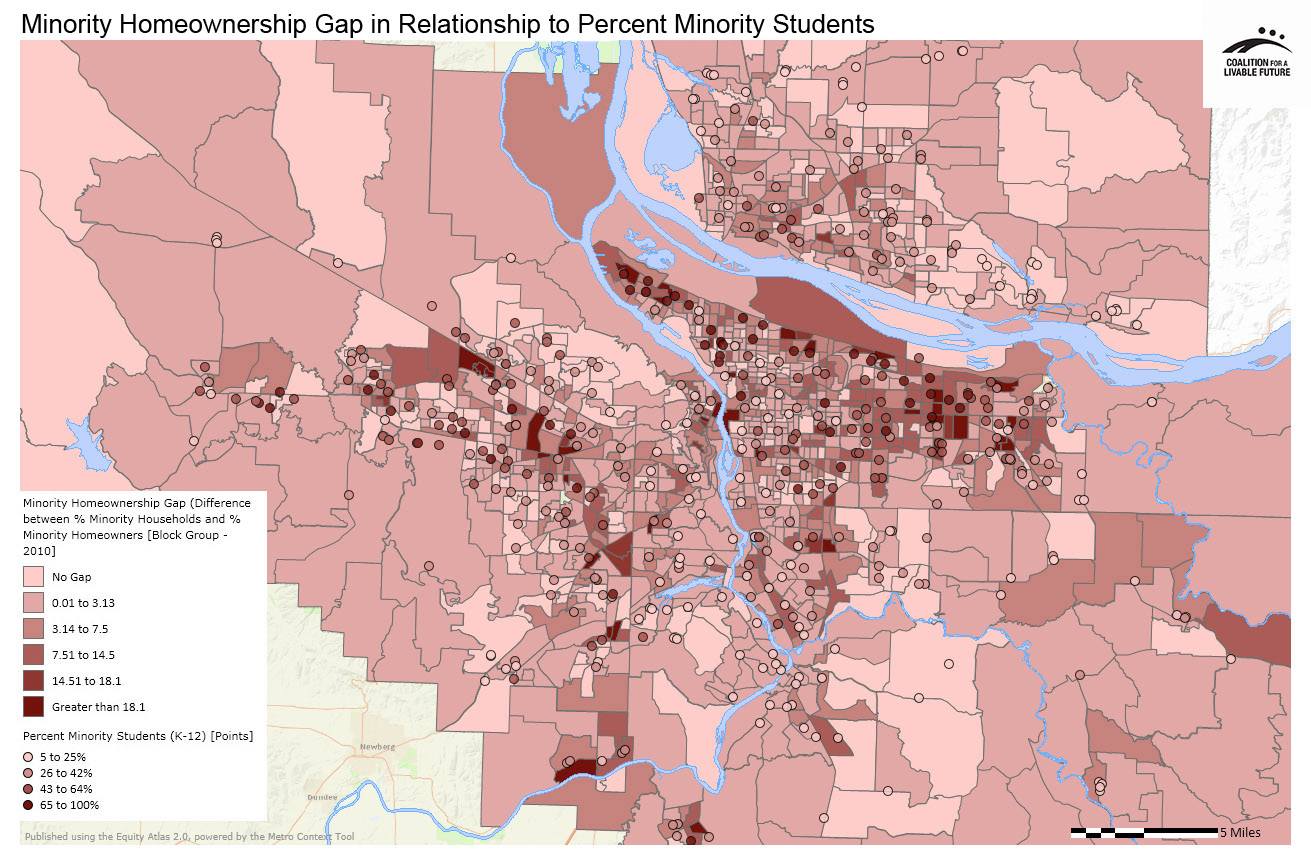
The Minority Home Ownership Gap in Relationship to Percent Minority Students map most directly speaks to the relationship between where students of color attend school and the relative access households of color have to purchase a home in the areas adjacent to that school. The Percent Minority Students layer can also be used as a proxy for the racial and ethnic diversity of the surrounding neighborhood (with the caveat that not all schools are comprised of students from the local community).
In many areas on the map, the locations of block groups with high minority home ownership gaps tend to align with the locations of schools with high percentages of minority students. Conversely, the locations of block groups with low minority home ownership gaps tend to align with the locations of schools with low percentages of minority students. But there are also some areas on the map with low minority home ownership gaps and high percentages of minority students, which is notable. These areas are located in Portland’s Brentwood / Darlington, Boise, Concordia, Parkrose and Argay neighborhoods, as well as parts of Washington County, including Sommerset West-Elmonica North and the Aloha area.
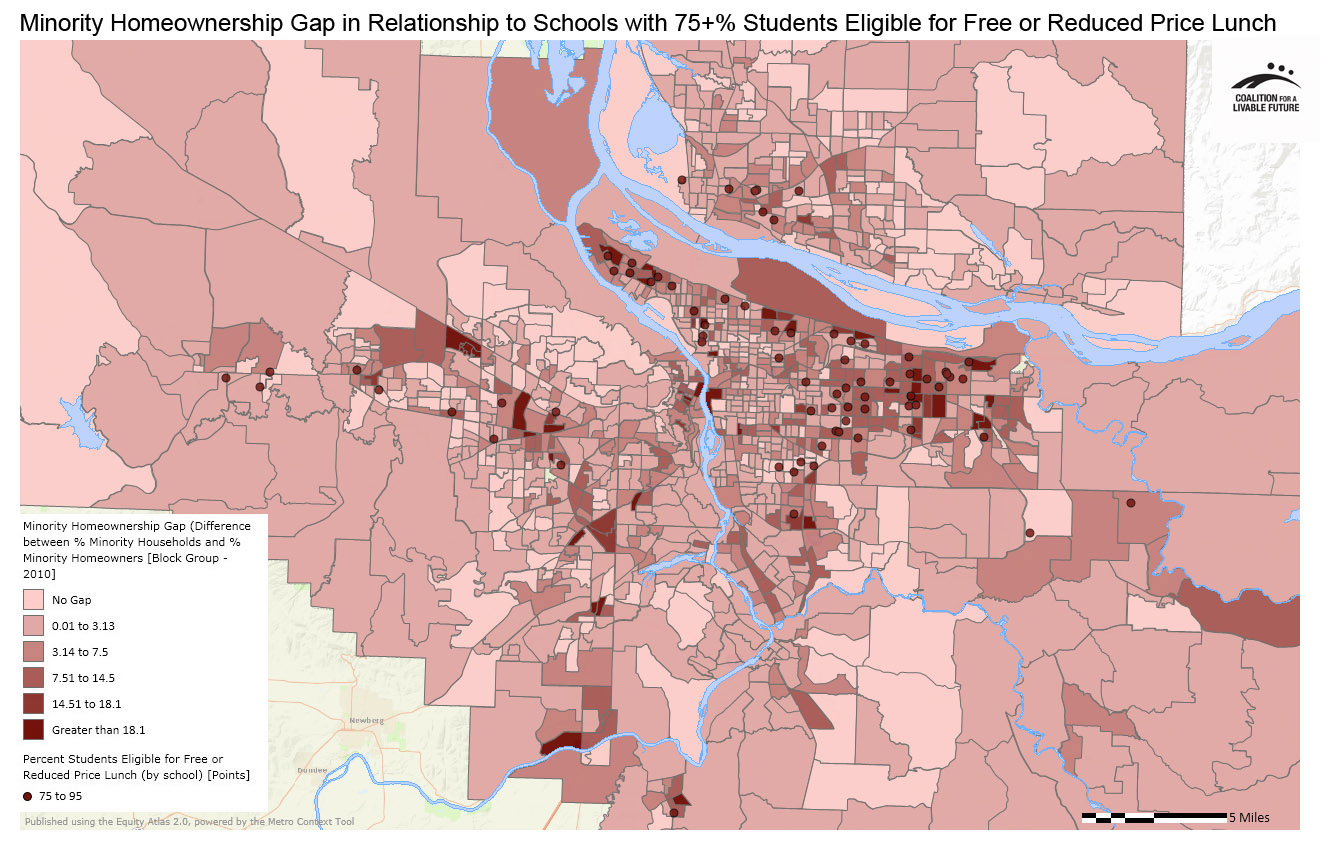
The Minority Home Ownership Gap in Relationship to Schools with 75% or More Students Eligible for Free or Reduced Price Lunch map offers insights into the connection between poverty rates and home ownership rates. The map highlights the region’s public schools with more than 75% of students eligible for free or reduced price lunch, as a proxy for neighborhood poverty (again, with the caveat that not all schools are comprised of students from the local community).
The map shows a general pattern of alignment between areas with high student poverty rates and medium to high minority home ownership gaps. This alignment is most visible in the St. Johns and Portsmouth neighborhoods in north Portland, as well as in several neighborhoods in Gresham and outer east Portland. Less striking, but still notable relationships can be seen in closer-in areas of north Portland like the Humboldt neighborhood, the adjacent Cully and Roseway neighborhoods in northeast Portland, and the Southgate neighborhood in Clackamas County near Milwaukie.
The maps in this series indicate that there are significant gaps in home ownership between communities of color and whites throughout the Portland metro region. In many places, these gaps are considerable. Moreover, the areas with the greatest gaps also tend to be areas with high rates of poverty and higher percentages of populations of color. These findings present a critical equity concern for the region and merit further research to develop targeted strategies to address the problem.
About the Maps
Minority Home Ownership Gap
This map reflects the disparity in regional home ownership rates between whites and minorities (defined as anyone except non-Hispanic whites) by census block group. The “gap” is calculated by the following formula: minority households as a percentage of all households minus minority home owning households as a percentage of all home owning households. If minority home ownership rates were equal to or greater than the minority population size, the “gap” would equal 0 or less. Positive numbers indicate a minority home ownership gap (the larger the number the greater the gap).
Data Source: U.S. Census (2010)
Minority Home Ownership Gap in Relationship to Schools with 75% or More of Students Eligible for Free or Reduced Price Lunch
This map layers the Percent Students Eligible for Free or Reduced Price Lunch by school point layer on top of the Minority Home Ownership Gap map. The Percent Students Eligible for Free or Reduced Price Lunch map has been modified to highlight schools with 75% or more eligible students.
Data Source: U.S. Census (2010), Oregon Department of Education & Washington Office of the Superintendent of Public Instruction (2011-2012)
Minority Home Ownership Gap in Relationship to Percent Minority Students
This map layers the Percent Minority Students by school point layer on top of the Minority Home Ownership Gap map.
Data Source: U.S. Census (2010); Oregon Department of Education & Washington Office of the Superintendent of Public Instruction (2011-2012)
|
This document was downloaded from the Map Series library of the Coalition for a Livable Future’s Regional Equity Atlas 2.0 website. The Regional Equity Atlas is a research and education project to promote widespread opportunity for a stronger, healthier, and more sustainable Portland-Vancouver metropolitan region. For more information, visit www.equityatlas.org. |
