Proximity to Supplemental Food Programs
For the region’s lowest income residents, living near a grocery store or supermarket does not necessarily translate into access to food due to the cost of buying food and other basic necessities. Many residents rely on sources of supplemental nutrition, such as food pantries, school-based summer meal sites, and SNAP (Supplemental Nutrition Assistance Program, also known as food stamps).
This map series shows proximity to supplemental food locations and how the distribution of those locations compares with the distribution of poverty across the region. It includes maps showing (a) proximity to food pantries and summer meal programs, (b) proximity to grocery stores and farmers’ markets that accept SNAP; and (c) a composite map showing how the locations of these resources compare with the locations of populations in poverty.


What the Maps Tell Us: Initial Findings
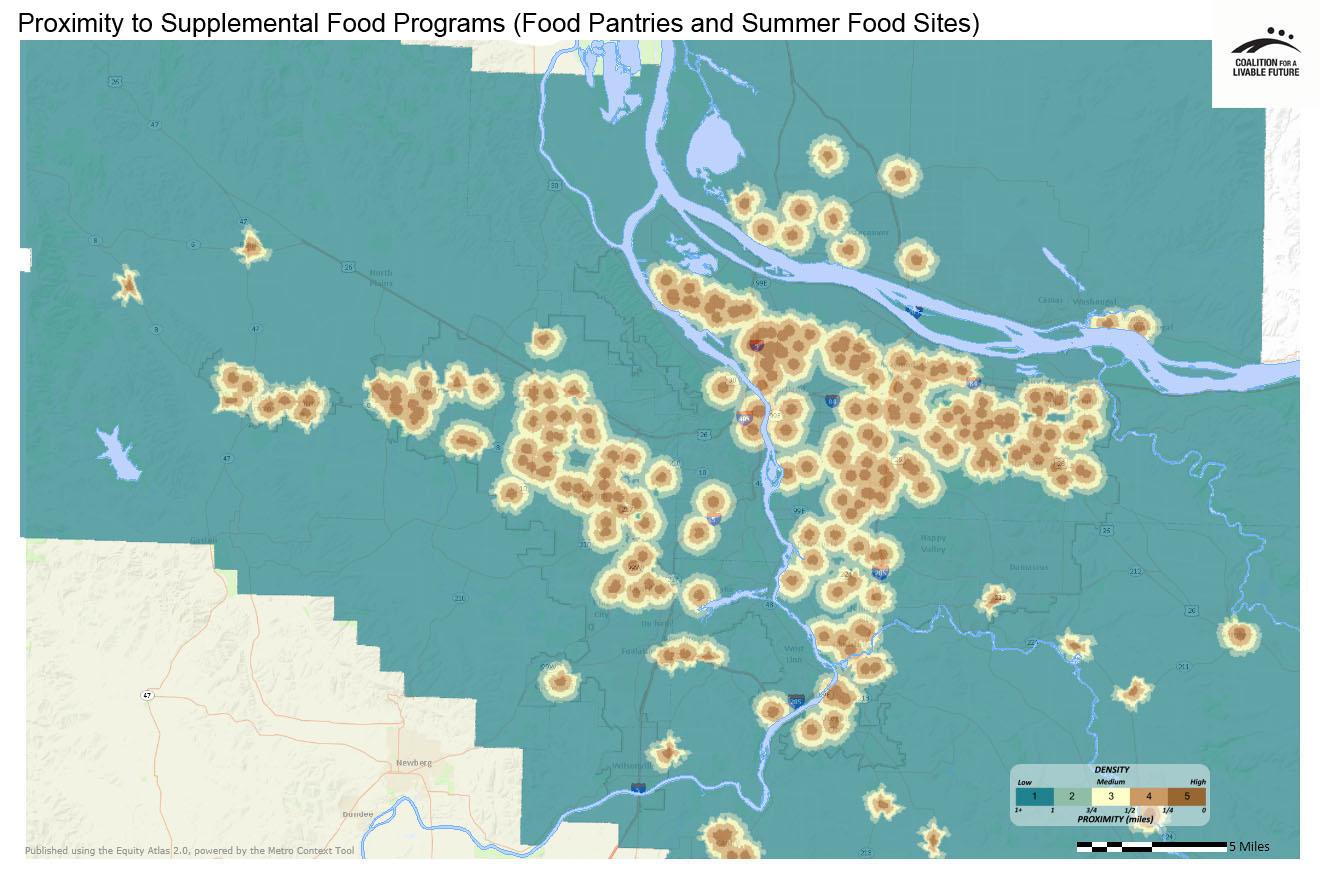
The neighborhoods with the highest scores in the Proximity to Supplemental Food Programs (Food Pantries and Summer Food Sites) map tend to be located in the more urban and densely populated areas of the region. The Atlas mapping tool can be used to assign a proximity score to every neighborhood in the region based on the average proximity of each block in the neighborhood to a supplemental food program. A score of “5” indicates proximities within ¼ mile, while a score of “1” or below indicates proximities greater than 1 mile. Of the ten neighborhoods with the highest proximities to supplemental food programs, most are located in north/northeast Portland, primarily in historically high poverty neighborhoods:
|
Neighborhood |
Location |
Proximity to Food Pantries and Summer Food Sites |
|---|---|---|
|
Humboldt |
Portland |
4.69 |
|
Boise |
Portland |
4.57 |
|
King |
Portland |
4.57 |
|
Glenfair |
Portland |
4.52 |
|
Portsmouth |
Portland |
4.45 |
|
Greshem-Asert |
Gresham |
4.43 |
|
Boise/Eliot |
Portland |
4.42 |
|
Sabin |
Portland |
4.41 |
|
Roseway/Madison South |
Portland |
4.39 |
|
Woodland Park |
Portland |
4.38 |
The neighborhoods with the lowest proximity to supplemental food programs are primarily located in unincorporated areas and neighborhoods with low population densities.
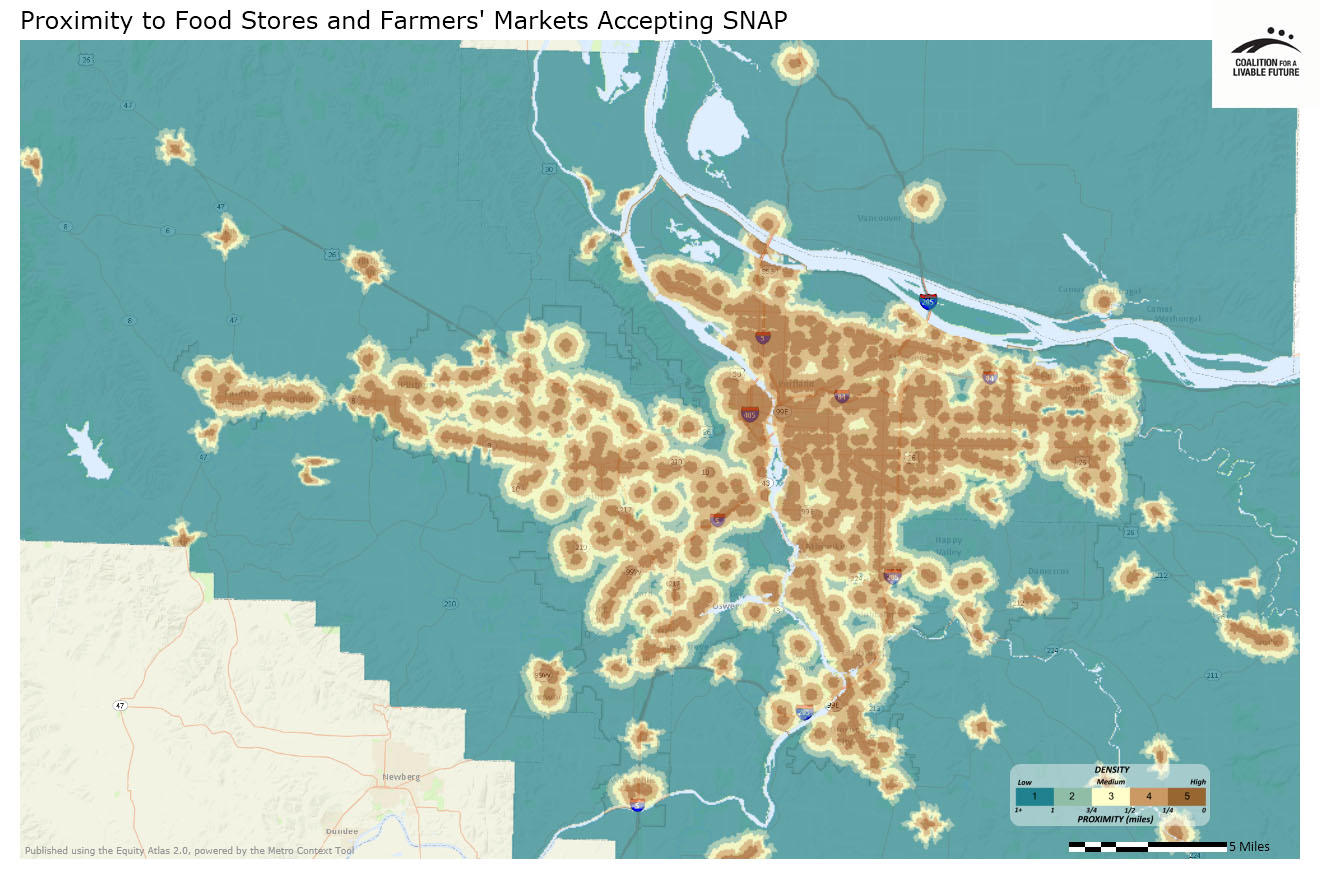
Many of the neighborhoods with the highest proximity scores on the Proximity to Food Stores and Farmers’ Markets Accepting SNAP map also have high proximity scores on the Proximity to Supermarkets, Grocery Stores, and Fresh Food Composite map. This suggests that SNAP acceptance is fairly widespread among food retailers in the region. The ten neighborhoods in the region with the highest proximity to food retailers accepting SNAP are:
|
Neighborhood |
Location |
Proximity to Food Retailers Accepting SNAP |
|---|---|---|
|
Multnomah County Unclaimed #6 |
Portland |
5.00 |
|
Humboldt |
Portland |
4.97 |
|
Hollywood |
Portland |
4.97 |
|
Hazelwood/Mill Park |
Portland |
4.94 |
|
Grant Park/Hollywood |
Portland |
4.93 |
|
Arbor Lodge |
Portland |
4.90 |
|
Goose Hollow |
Portland |
4.90 |
|
King |
Portland |
4.89 |
|
Gresham-City Central |
Gresham |
4.89 |
|
Vernon |
Portland |
4.83 |
The neighborhoods with the lowest proximities to food retailers accepting SNAP tend to be located in unincorporated areas and neighborhoods that are not densely populated. Neighborhoods in Clark County should not be analyzed using this indicator, because the data source did not include Clark County grocery stores.
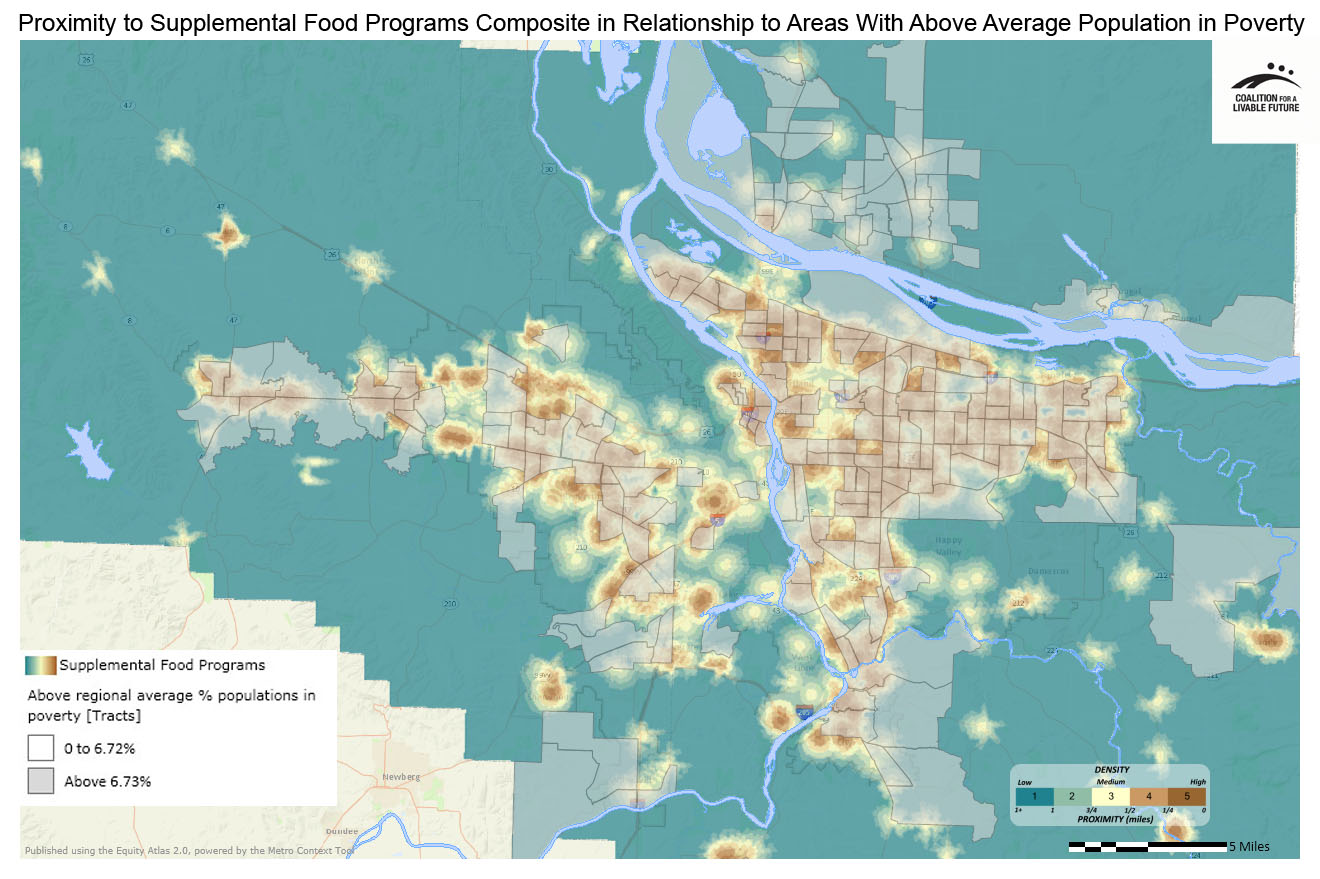
A visual scan of the Proximity to Supplemental Food Locations (SNAP and Food Pantries) in Relationship to Areas with Above Regional Average Percent Populations in Poverty map suggests a general alignment between the locations of higher poverty census tracts and the locations of supplemental nutrition sources across the region. But there are still some high poverty census tracts with poor access to supplemental nutrition. The map can be used to identify the census tracts across the region with the greatest imbalance between supplemental food need and access. For example, the table below lists the ten census tracts with the highest poverty rates in the region. Many have good access to supplemental food, but a few clearly do not:
|
Census Tract |
Location |
Proximity to Food Pantries and Summer Food Sites |
Proximity to Food Retailers Accepting SNAP |
|---|---|---|---|
|
41051010600 |
Downtown Portland |
3.85 |
4.43 |
|
41051003301 |
Northeast Portland |
4.73 |
4.91 |
|
53011042700 |
Vancouver |
2.36 |
N/A |
|
53011041600 |
Vancouver |
3.38 |
N/A |
|
41051009606 |
Gresham |
4.41 |
4.67 |
|
41051003401 |
Northeast Portland |
4.90 |
5.00 |
|
53011041005 |
Vancouver |
0.78 |
N/A |
|
41067033200 |
Forest Grove |
2.12 |
2.49 |
|
53011041111 |
Vancouver |
2.76 |
N/A |
|
41051009301 |
Outer East Portland |
4.26 |
4.17 |
Several census tracts in Vancouver and one in Forest Grove have high poverty levels and very low proximity to supplemental food sources. Further analysis of these and other census tracts with similar patterns could help to inform efforts to address food insecurity in our region.
The Atlas online mapping tool provides additional data that can be combined with these maps to develop a more complete understanding of how well specific populations can access supplemental nutrition. The locations of supplemental nutrition programs can be overlaid with demographic data on populations in poverty, seniors, children, and people of color to assess levels of geographic access. These maps can also be considered alongside Atlas maps showing the locations of grocery stores and farmers’ markets that accept WIC (Supplemental Nutrition Program for Women, Infants, and Children).
About the Maps
Proximity to Supplemental Food Programs (Food Pantries and Summer Food Sites)
This map shows proximity to food pantries and summer food programs around the region.
Data Source: 211info (food pantries), 2012; Metro School Districts and web research (summer food programs), 2012
Proximity to Food Stores and Farmers’ Markets Accepting SNAP
This map shows proximity to grocery stores and farmers’ markets that accept payment via Supplemental Nutrition Assistance Program benefits (formerly known as food stamps). It does not include data on grocery stores in Clark County.
Data Source: U.S. Department of Agriculture, 2012
Proximity to Supplemental Food Locations (SNAP and Food Pantries) in Relationship to Areas with Above Regional Average Percent Populations in Poverty
This map layers the census tracts with populations in poverty above the regional average on top of a composite map that combines the Proximity to Supplemental Food Programs (Food Pantries and Summer Food Sites) and the Proximity to Food Stores and Farmers’ Markets Accepting SNAP maps.
Data Source: American Community Survey 5-Year Estimates, 2006-2010; 211info, 2012; Metro School Districts and web research, 2012; U.S. Department of Agriculture, 2012
|
This document was downloaded from the Map Series library of the Coalition for a Livable Future’s Regional Equity Atlas 2.0 website. The Regional Equity Atlas is a research and education project to promote widespread opportunity for a stronger, healthier, and more sustainable Portland-Vancouver metropolitan region. For more information, visit www.equityatlas.org. |
