Graduation Rates
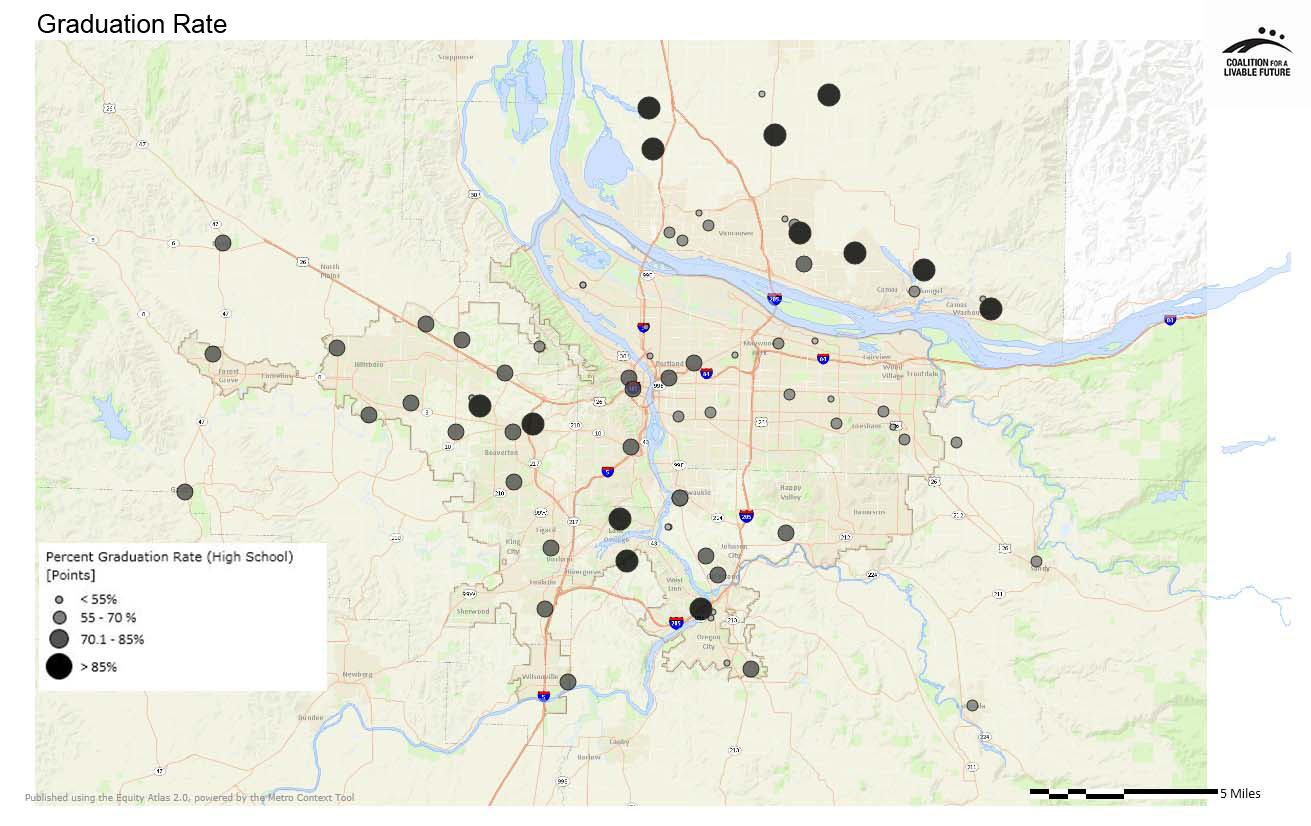
Youth who drop out of high school have a greater likelihood of delayed employment opportunities, poverty, and poor health than those who graduate. For this reason, graduation rates are a key indicator of economic opportunity. This map series shows the graduation rates at the region’s high schools and how those rates compare with the distribution of populations of color and populations in poverty throughout the region.


What the Maps Tell Us: Initial Findings
The Graduation Rate map presents an interesting pattern in which the suburbs are generally outperforming many of Portland’s high schools. Of the ten high schools in the region with the highest percentages of students graduating along with their cohort, six are located in Clark County, and four are located in suburban areas to the south and west of Portland. Six of these schools have below average percentages of students of color and students in poverty, but, notably, four do not. This includes two Beaverton magnet schools (Arts & Communication High School and School of Science and Technology), Union High School in Camas and Prairie High School in Vancouver, all of which have above average percentages of students in poverty and/or students of color.
|
High School Name
|
% Graduation rate |
Above average % students of color? |
Above average poverty rate? |
Location |
|---|---|---|---|---|
|
Camas High School |
96.5 |
No |
No |
Camas (Clark County) |
|
Union High School |
95.1 |
Yes |
No |
Camas (Clark County) |
|
Prairie High School |
94.8 |
No |
Yes |
Vancouver (Clark County) |
|
Battle Ground High School |
94.5 |
No |
No |
Battle Ground (Clark County) |
|
Hockinson High School |
94.1 |
No |
No |
Vancouver (Clark County) |
|
Ridgefield High School |
92.0 |
No |
No |
Ridgefield (Clark County) |
|
West Linn High School |
89.5 |
No |
No |
West Linn (Clackamas County) |
|
Arts & Communication High School |
89.5 |
Yes |
Yes |
Beaverton (Washington County) |
|
School of Science & Technology |
88.5 |
Yes |
Yes |
Beaverton (Washington County) |
|
Lake Oswego High School |
87.4 |
No |
No |
Lake Oswego (Clackamas County) |
The list of high schools with the lowest graduation rates also reveals some interesting patterns, with low performing schools scattered throughout the region, and only one within Portland city limits. The performance of these schools may have little to do with locational access to opportunity, since many schools on the list are web academies, international schools, and other types of alternative schools whose student bodies are drawn from a broad geographic area. Nine out of the ten schools have above average percentages of students in poverty and/or students of color.
|
High School Name
|
% Graduation rate |
Above average % students of color? |
Above average poverty rate? |
City/Neighborhood |
|---|---|---|---|---|
|
Estacada Alternative High School |
5.3 |
No |
No |
Estacada (Clackamas County) |
|
Gresham-Barlow Web Academy |
14.3 |
Yes |
Yes |
Gresham (Multnomah County) |
|
Oregon City Service Learning Academy |
22.2 |
No |
Yes |
Oregon City (Clackamas County) |
|
Centennial Learning Center |
25.0 |
Yes |
Yes |
Gresham (Multnomah County) |
|
Community High School |
26.9 |
Yes |
Yes |
Beaverton (Washington County) |
|
Spanish-English International School at Roosevelt |
27.0 |
Yes |
Yes |
Portland (Multnomah County) |
|
Merlo Station High School |
28.2 |
Yes |
Yes |
Beaverton (Washington County) |
|
Lewis and Clark High School |
28.9 |
Yes |
Yes |
Vancouver (Clark County) |
|
New Urban High School |
34.9 |
No |
Yes |
Milwaukie (Clackamas County) |
|
Clackamas Web Academy |
35.8 |
Yes |
Yes |
Clackamas (Clackamas County) |
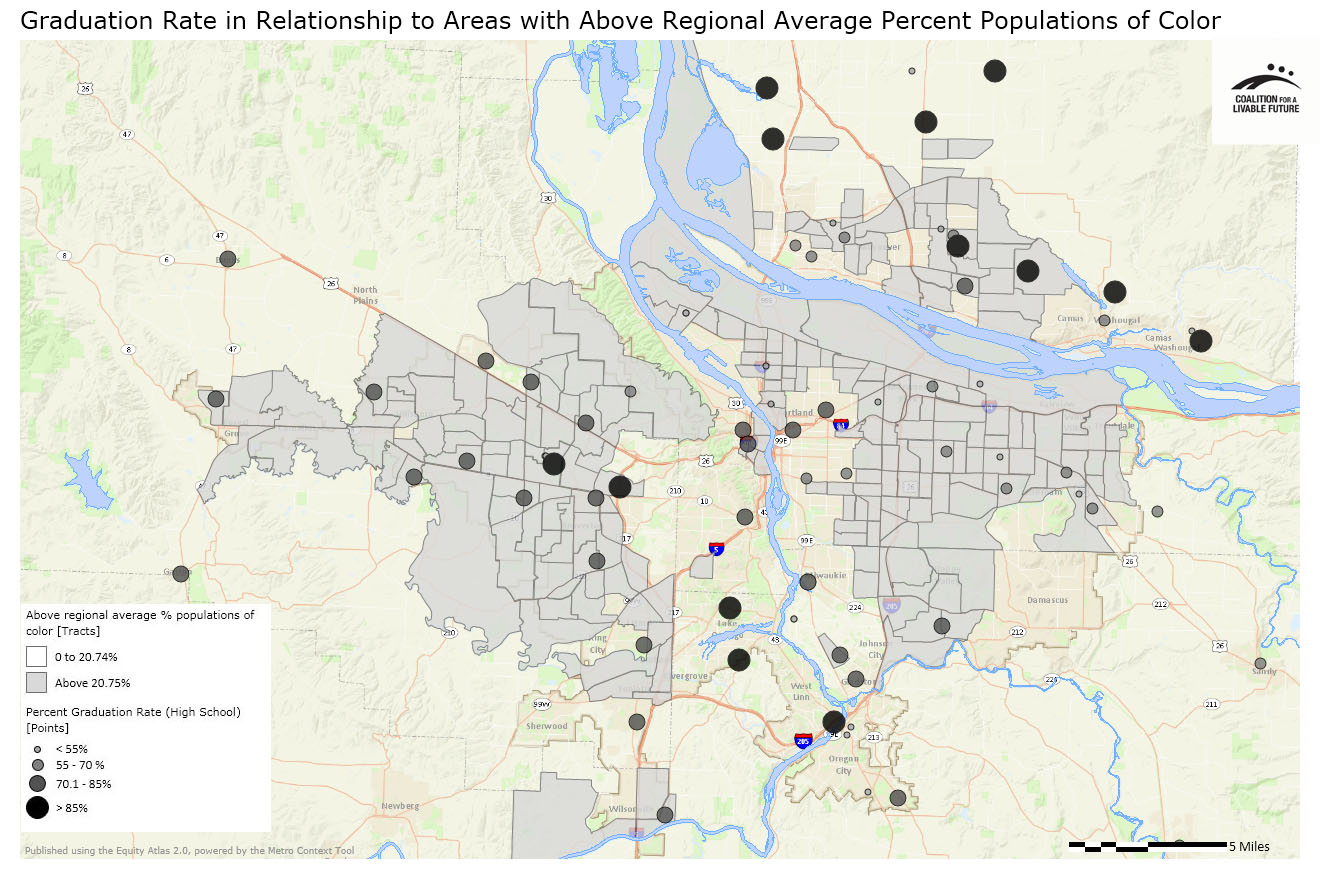
Further information related to the relationship between graduation rates and race can be gathered from the Graduation Rate in Relationship to Areas with Above Regional Average Percent Populations of Color map. Out of the ten schools with the highest graduation rates in the region, three schools – Union High School, Arts & Communication High School and the School of Science and Technology – are located in census tracts with higher than average percentages of populations of color. However, both the Arts & Communication High School and School of Science and Technology are magnet schools that draw students from throughout the Beaverton School District. Of the ten schools in the region with the lowest graduation rates in the region, seven schools are located within census tracts containing above average percentages of populations of color.
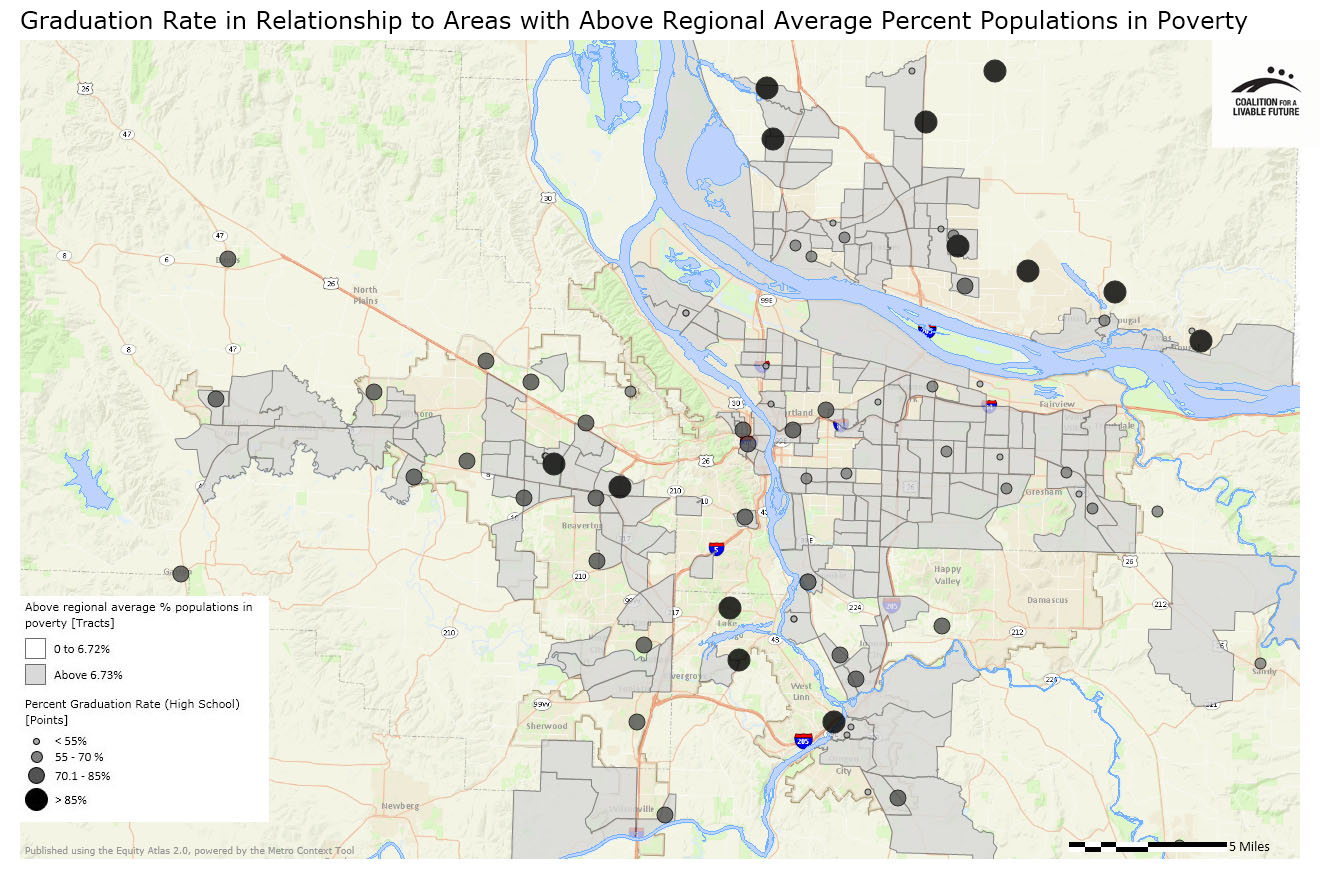
Similar patterns can be found in the Graduation Rate in Relationship to Areas with Above Regional Average Percent Populations in Poverty map. Of the ten schools in the region with the highest graduation rates, three schools – Prairie High School, Arts & Communication High School and the School of Science and Technology – are located in census tracts with higher than regional average percent populations in poverty. (Again, this finding is less relevant for Arts & Communication High School and the School of Science and Technology since both are magnet schools that serve the entire Beaverton School District.) Of the ten schools in the region with the lowest graduation rates, nine are located in census tracts with higher than average poverty rates. Interestingly, the lowest performing high school in the region – Estacada Alternative High School – is not located in a high-poverty census tract.
About the Maps
Graduation Rate
This map depicts the percent of students graduating with a high school diploma by cohort.
Data Source: Oregon Department of Education and Washington Office of the Superintendent of Public Instruction, 2011-12
Graduation Rate in Relationship to Areas with Above Regional Average Percent Populations of Color
This map layers the Graduation Rate map with a map showing the census tracts with above the regional average percent populations of color.
Data Source: American Community Survey 5-Year Estimates 2006-2010, Oregon Department of Education and Washington Office of the Superintendent of Public Instruction, 2011-12
Graduation Rate in Relationship to Areas with Above Regional Average Percent Populations in Poverty
This map layers the Graduation Rate map with a map showing the census tracts with above the regional average percent populations in poverty.
Data Source: American Community Survey 5-Year Estimates 2006-2010, Oregon Department of Education and Washington Office of the Superintendent of Public Instruction, 2011-12
|
This document was downloaded from the Map Series library of the Coalition for a Livable Future’s Regional Equity Atlas 2.0 website. The Regional Equity Atlas is a research and education project to promote widespread opportunity for a stronger, healthier, and more sustainable Portland-Vancouver metropolitan region. For more information, visit www.equityatlas.org. |
