Walkability
Walkable neighborhoods promote physical activity, reduce vehicle trips, and increase the independence of seniors, youth, and others without access to cars. Walkable neighborhoods also foster greater social cohesion and a sense of community.
According to Oregon Walks, “a walkable neighborhood is one with sidewalks to key neighborhood destinations, accessible and frequent crossings, and traffic-calmed streets. A walkable neighborhood is also an area that openly invites people to walk by intentional design, one that allows people to age comfortably in place and to use walking, biking and transit as equally convenient transportation options.”
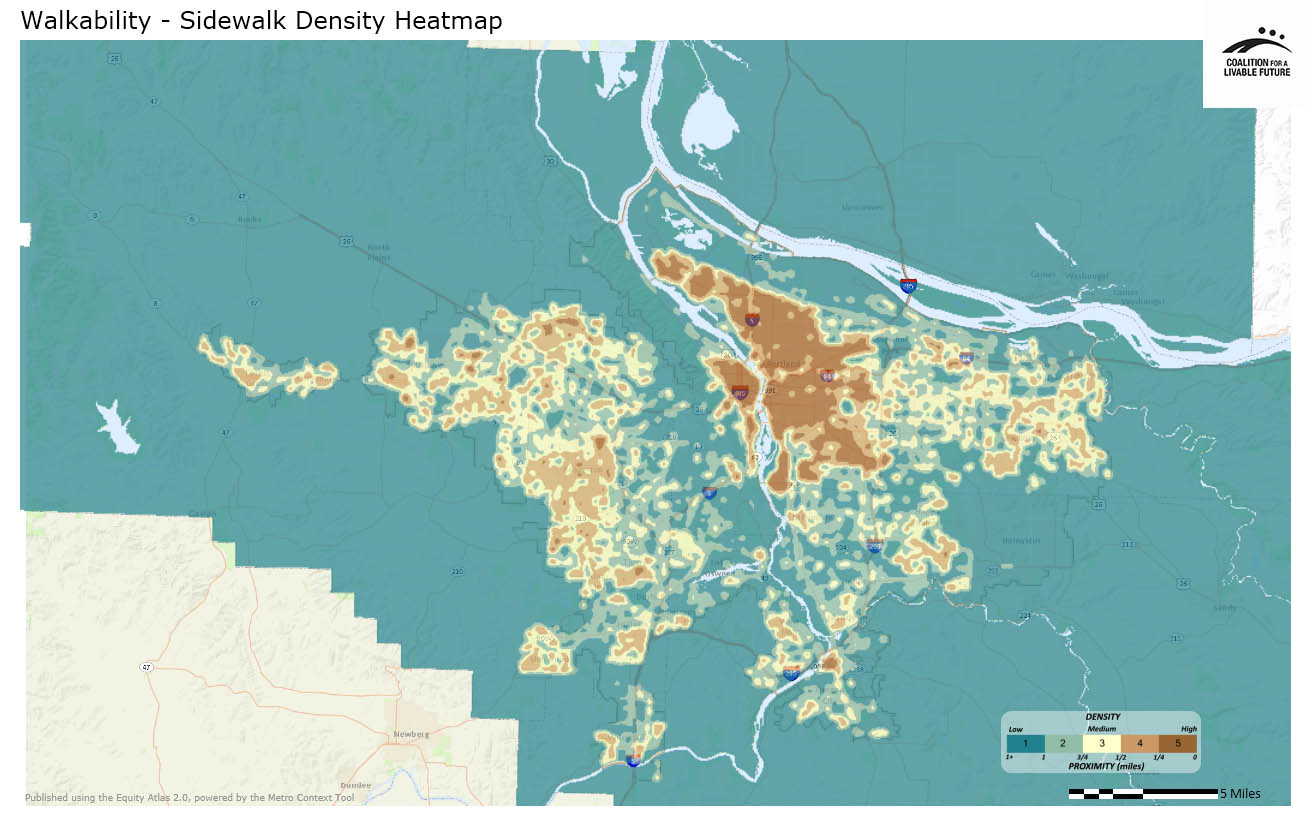
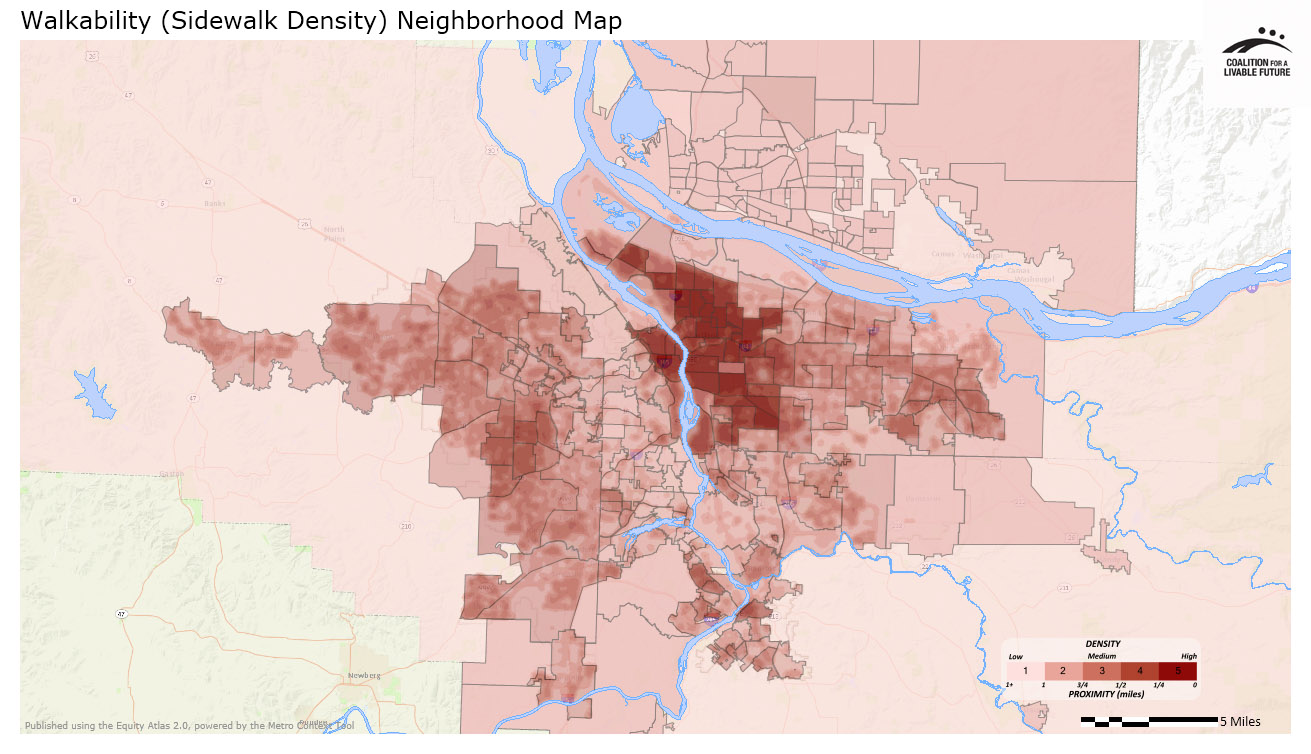
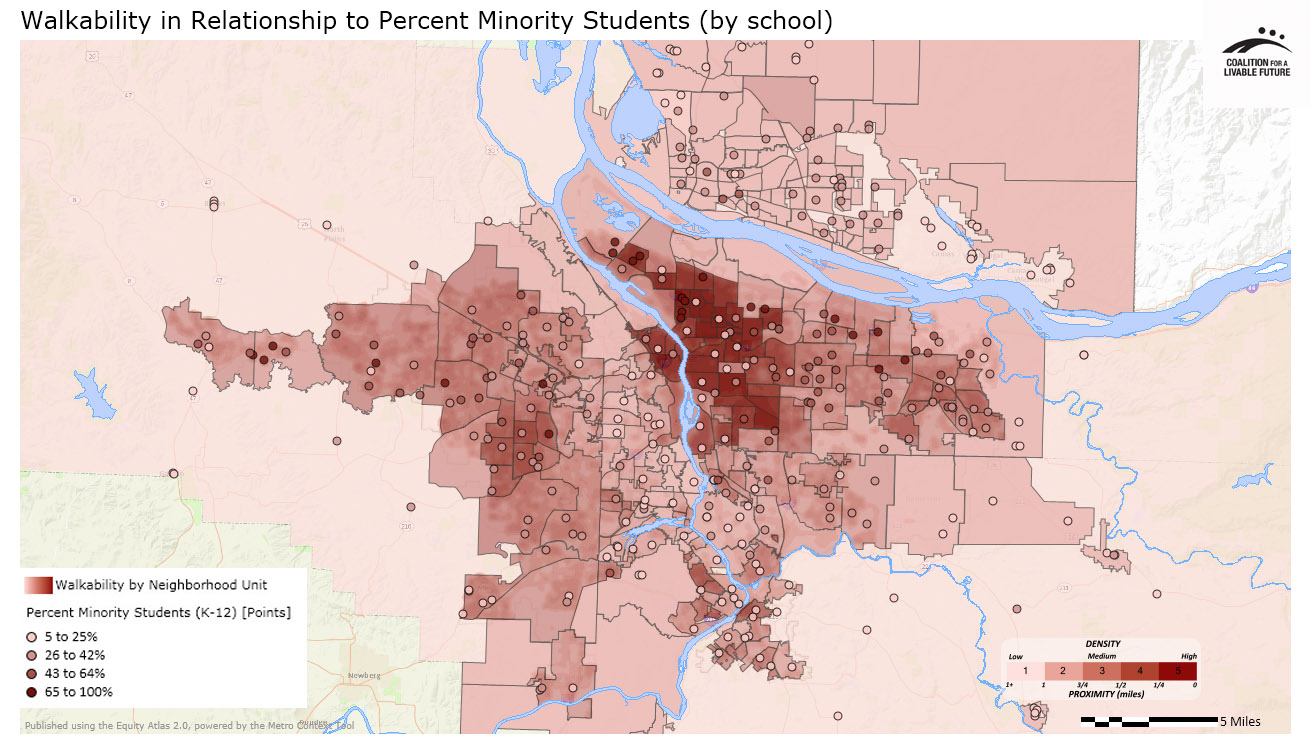
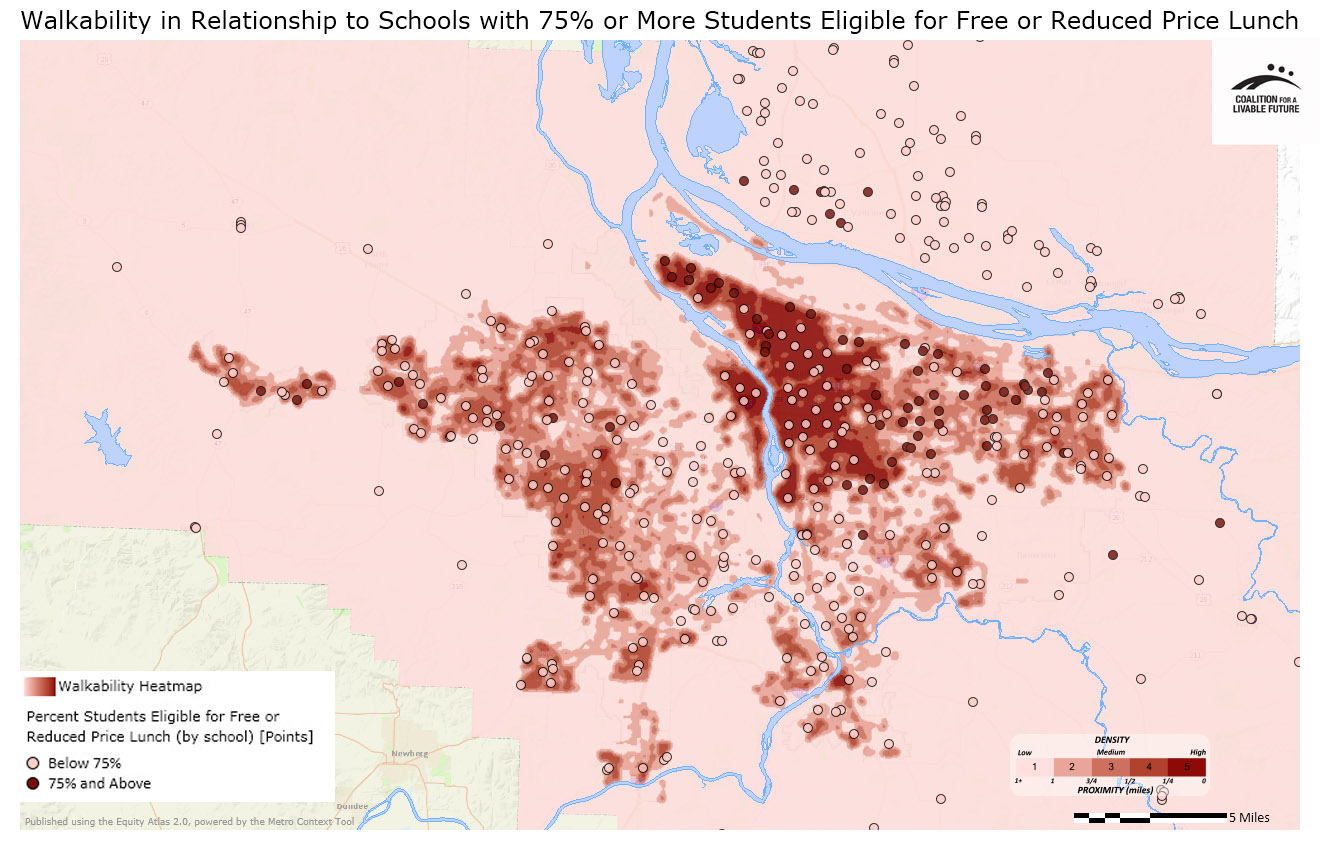
Comprehensive data are not available to enable us to map all of the built environment features that are necessary for a truly walkable neighborhood, such as traffic calming, curb cuts, and crosswalks. But we can map one of the most fundamental features of a walkable neighborhood – sidewalk density. This map series shows the density of sidewalk coverage across the region (excluding Clark County due to inadequate data). It includes (a) a sidewalk density heatmap; (b) a sidewalk density by neighborhood map; (c) a map showing sidewalk density in relationship to the percentage of minority students by school; and (d) a map showing sidewalk density in relationship to schools with 75% or more of students eligible for free and reduced price lunch. The school data in maps (c) and (d) are used both as a proxy for neighborhood poverty and race, and because walkability is especially relevant for children and youth.


What the Maps Tell Us: Initial Findings
Note: The walkability maps do not include data for Clark County, so this analysis is limited to the Oregon portion of the four-county region.
Patterns of sidewalk coverage across the region are in many ways a reflection of the differing ages of neighborhoods. Older communities have grid-patterned streets with more complete sidewalk coverage. Newer communities (post-1950) tend to be more car-oriented and have fewer sidewalks. However, there are some newer neighborhoods in our region with relatively high levels of sidewalk coverage. Given the importance of sidewalks for promoting walking as a safe and viable mode of transportation, these examples of good urban planning are notable.
In neighborhoods with streets that have limited vehicle traffic and low vehicle speeds, walking may be relatively safe and easy for most residents even without sidewalks. In those communities, increasing sidewalk coverage may not be viewed as a high priority. With limited resources, it makes sense to prioritize investments in neighborhoods where sidewalks are essential for pedestrian safety. But it is also important to note that even in neighborhoods where sidewalks may be seen as a lower priority, they are a critical resource for people with disabilities, children, and others for whom walking in the street is not a viable option.
The Walkability-Sidewalk Density map highlights several areas of the region with high levels of sidewalk coverage. The largest areas with consistently high sidewalk densities (i.e. the darker brown areas of the map) include most of the older neighborhoods in the city of Portland west of I-205 as well as specific sections of many of the region’s other cities, including the cities’ central business districts as well as older, more urbanized neighborhoods. The densities are particularly high – meaning the most complete sidewalk coverage across the entire city boundaries -- in King City, Johnson City, Beaverton, Cornelius, Tigard, and Gresham.
The Walkability Neighborhood Map shows the neighborhoods with the most complete sidewalk coverage across the entire neighborhood. All of the neighborhoods with the highest density scores are in Portland’s inner east side. Neighborhoods outside Portland with relatively high density scores include neighborhoods in parts of Beaverton, West Linn, Gresham, Oregon City, and Johnson City.
The other maps in the series use schools’ race and free and reduced price lunch data both as a proxy for neighborhood demographics and because the ability to walk safely to school is an important attribute of a livable and healthy community. The Walkability in Relationship to Percent Minority Students by School map indicates that the schools in the areas of Portland’s inner east side with the best sidewalk coverage include a mix of schools with high and low percentages of students of color. There are also some schools with high percentages of students of color on Portland’s outer east side and parts of Gresham, Beaverton, Hillsboro, and Cornelius, in neighborhoods that have decent, but not the highest, levels of sidewalk coverage. Almost all of the schools in the outlying areas of the region with the lowest sidewalk coverage levels also have relatively low percentages of students of color. The exception is Lee Elementary in Canby, which has a high percentage of students of color and is located in a neighborhood with low sidewalk densities.
The Walkability in Relationship to Schools with 75% of More of Students Eligible for Free and Reduced Price Lunch map indicates that the areas with the most complete sidewalk coverage include a mix of both high-poverty and low-poverty schools. In the city of Portland, in the neighborhoods with the densest sidewalk coverage, the schools located closest to downtown tend to have lower poverty levels whereas the schools further north and east of downtown tend to have higher poverty levels. Sidewalk coverage becomes less dense towards outer east Portland, and the schools in those areas are predominately high poverty.
Outside of Portland, most of the high poverty schools in the more densely populated areas of east Multnomah County, Washington County, and Clackamas County are located in areas with sidewalk coverage that is reasonably good, though not as good as in Portland’s close-in neighborhoods. However, there are four high poverty schools in Clackamas County that are in areas with low levels of sidewalk coverage. These schools are Naas Elementary in Boring, and Cottrell Elementary east of Boring, Lee Elementary in Canby, and Welches Middle School in Welches.
The patterns in these maps suggest that, at a regional level, the presence of sidewalks is largely determined by factors such as neighborhood age, level of urbanization, and the local jurisdiction’s historic approach to planning. Because of the complexity of these factors, the relationship between sidewalk access and population demographics is not uniform across the region. While some neighborhoods with above average percentages of populations of color and/or populations in poverty have good sidewalk coverage, many such neighborhoods do not have adequate sidewalk coverage. In locations where lack of sidewalks significantly impacts neighborhood safety and walkability, these disparities are cause for concern. For example, the Walkability-Sidewalk Density map highlights several areas in outer east Portland and Gresham with poor sidewalk coverage along busy roads near schools with high percentages of students in poverty and students of color. The Atlas maps offer useful data for identifying neighborhoods like these that would benefit most from targeted investments in sidewalks.
About the Maps
Walkability – Sidewalk Density
This map shows the density of sidewalk coverage as a measure of the walkability of a particular area. It is based on a 1/4 mile radius, which is generally accepted as a reasonable walking distance. Unfortunately, good data on sidewalk coverage are not available for Clark County, so the map only includes meaningful data for the Oregon portion of the region.
Data Source: Metro RLIS (2012)
Walkability Neighborhood Map
This map uses the same underlying data as the Walkability-Sidewalk Density map. Instead of showing the data as a heatmap, it aggregates the data by neighborhood-level geography.
Data Source: Metro RLIS (2012)
Walkability in Relationship to Percent Minority Students by School
This map layers the Percent Minority Students by School point layer on top of the Walkability-Sidewalk Density map.
Data Source: Metro RLIS (2012); Oregon Department of Education & Washington Office of the Superintendent of Public Instruction (2011-2012)
Walkability in Relationship to Schools with 75% or More of Students Eligible for Free and Reduced Price Lunch
This map layers the Percent Students Eligible for Free and Reduced Price Lunch by school point layer on top of the Walkability-Sidewalk Density map.
Data Source: Metro RLIS (2012); Oregon Department of Education & Washington Office of the Superintendent of Public Instruction (2011-2012))
|
This document was downloaded from the Map Series library of the Coalition for a Livable Future’s Regional Equity Atlas 2.0 website. The Regional Equity Atlas is a research and education project to promote widespread opportunity for a stronger, healthier, and more sustainable Portland-Vancouver metropolitan region. For more information, visit www.equityatlas.org. |
