Transportation Access to Jobs
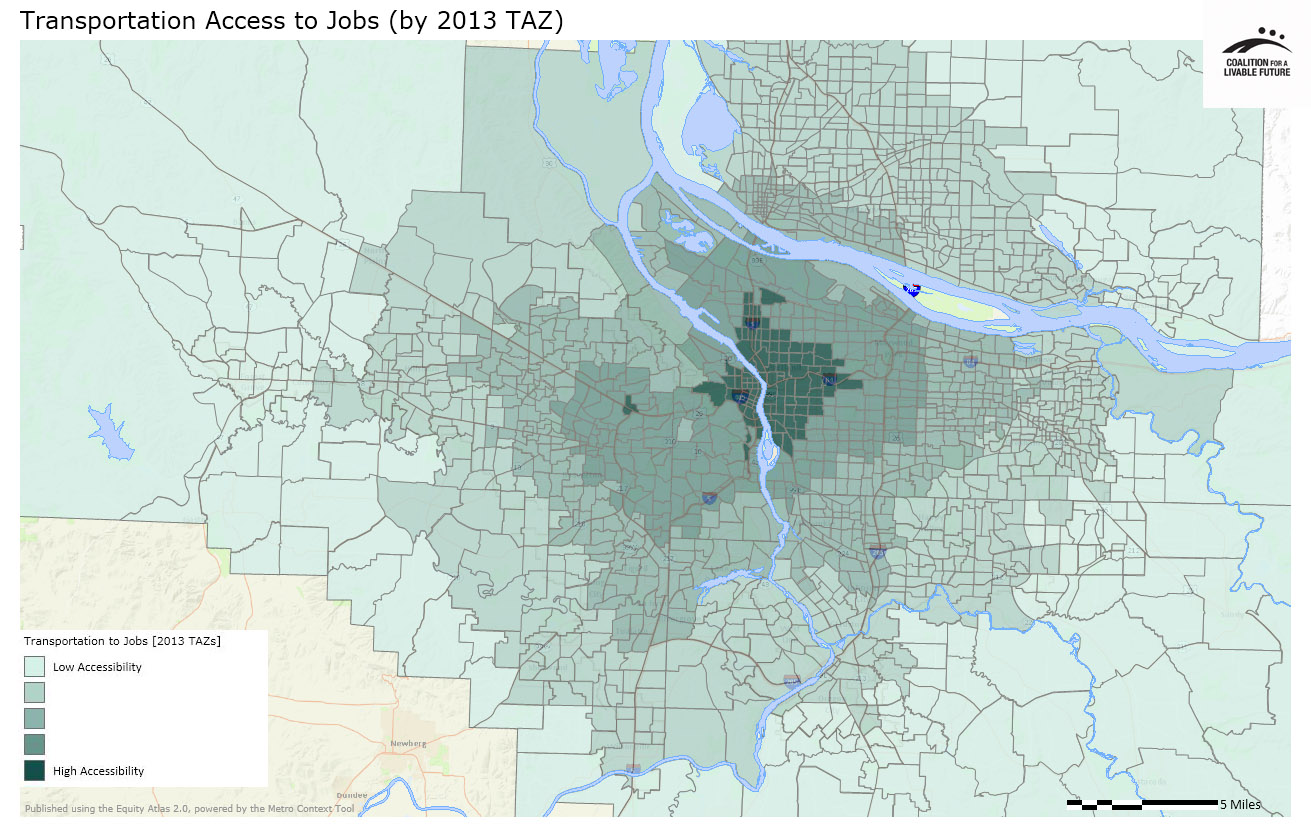
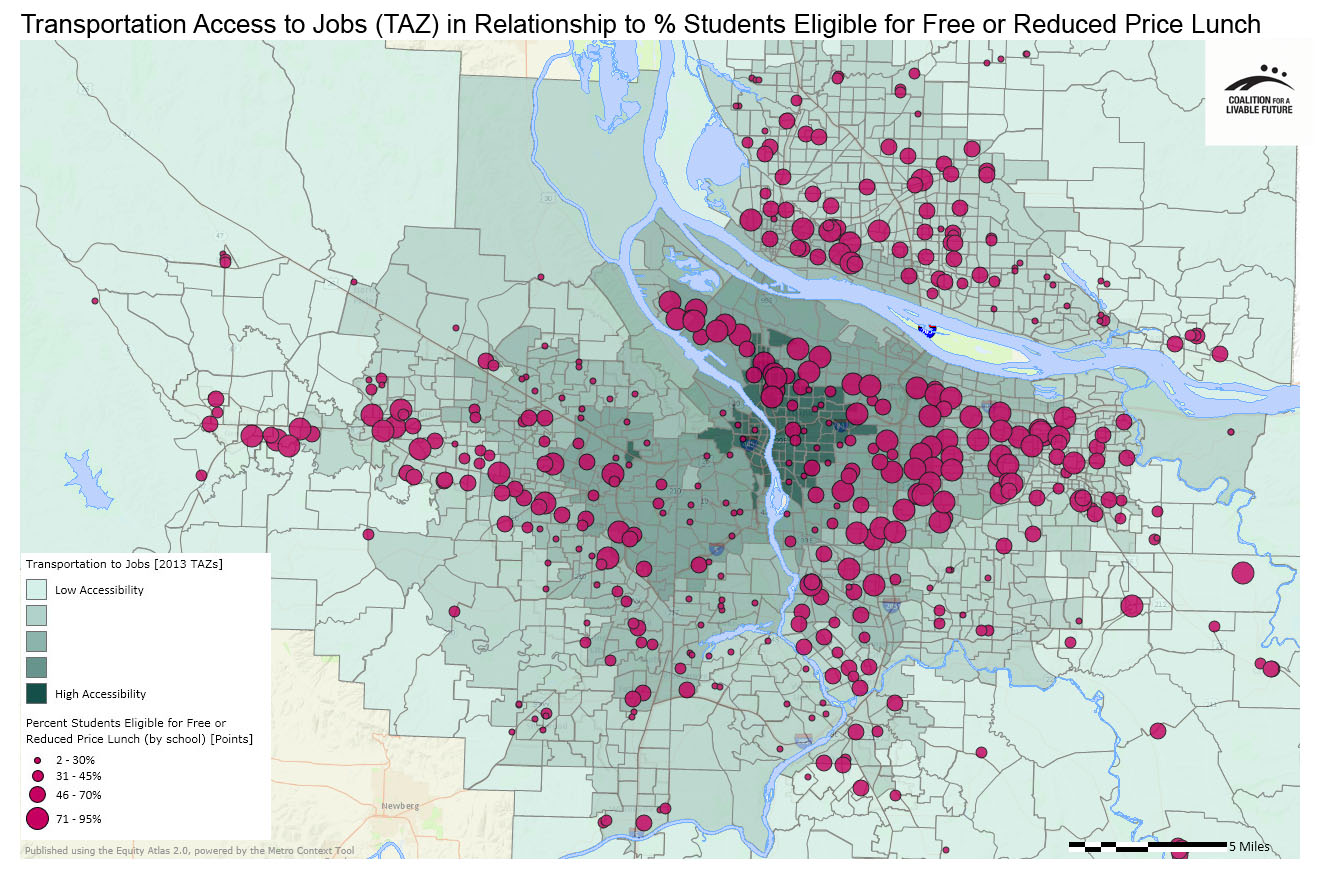
To create a prosperous region, we must ensure that everyone in our region has access to economic opportunities, including jobs that will enable them to meet their household’s needs. A baseline measurement of access to jobs in a neighborhood is whether the region’s jobs are within a reasonable commuting distance. The first map in this series uses Metro modeling data to depict the number of jobs that are accessible by one or more modes of transportation from any given location in the region. The second map adds poverty data to the first map to show how transportation access to jobs relates to regional demographic patterns. It uses the percentage of students eligible for free or reduced price lunch as a proxy for poverty because the free and reduced price lunch data are mapped in a format that can be easily layered with other maps while retaining the maps’ visual clarity.


What the Maps Tell Us: Initial Findings
The Transportation Access to Jobs by 2013 TAZ map is difficult to compare to other analysis layers due to its unique geographical analysis unit – the Transportation Analysis Zone (or TAZ). These boundaries were created by Metro in order to capture areas with similar uses and urban form, resulting in new analysis units that more accurately reflect transportation access to jobs than other boundaries like census tracts or neighborhoods. While this makes it difficult to relate these units to other, more recognizable boundaries, it is useful for studying patterns in transportation access around the region.
All but two of the TAZs that show up as having high transportation access to jobs are located within Portland city limits, grouped mostly in one big cluster in and around the urban core. These “high accessibility” TAZs are present in each of Portland’s five quadrants, extending east along the I-84 corridor from downtown to the North Tabor neighborhood; west to the Southwest Hills and Sylvan-Highlands neighborhoods; north to portions of the Kenton, Arbor Lodge, Piedmont and Woodlawn neighborhoods; and south along I-5 to the South Portland, Homestead and Hillsdale neighborhoods.
The two outliers on this map are located in the portions of Beaverton and Washington County near the intersection of Highways 217 and US-26 and the Sunset Transit Center MAX Station. These are the only TAZs with high accessibility ratings that are not located within Portland city limits.
The Transportation Access to Jobs (TAZ) in Relationship to Percent Students Eligible for Free or Reduced Price Lunch map uses student poverty data as a proxy for neighborhood poverty. It indicates that while there are clusters of high poverty schools located in areas with high transportation access to jobs, many of the region’s high poverty schools are located in areas with inadequate transportation access to jobs. This is particularly the case in western Washington County and unincorporated areas of Clackamas County. While school poverty data are not a perfect proxy for neighborhood poverty levels, this map suggests that, particularly in the region’s outlying areas, there are significant pockets of poverty where residents have difficulty accessing available jobs through any available transportation modes.
About the Maps
Transportation Access to Jobs by 2013 TAZ
This map depicts the number of jobs that households in a given Transportation Analysis Zone (TAZ) perceive as being accessible, based on Metro modeling. If a TAZ shows a high rating, that means that households in that TAZ have relatively good access to jobs.
Transportation analysis zones are intended to capture relatively homogenous areas for land use and urban form, and therefore travel behavior. The TAZ is the fundamental unit of geography in Metro’s transportation model.
Data Source: Metro 2013
Transportation Access to Jobs by 2013 TAZ in Relationship to Percent Students Eligible for Free or Reduced Price Lunch
This map layers the Percent Students Eligible for Free or Reduced Price Lunch point layer on top of the Transportation Access to Jobs by 2013 TAZ map. The Percent Students Eligible for Free or Reduced Price Lunch layer is being used here as a proxy for poverty, but bear in mind that in some school districts, children are free to attend schools that are not in their immediate neighborhood. This means that the spatial distribution of students based on school location might not reflect the location of their residence.
Data Source: Metro 2013, OR Department of Education 2011-2012; WA Office of the Superintendent of Public Instruction 2011-2012
|
This document was downloaded from the Map Series library of the Coalition for a Livable Future’s Regional Equity Atlas 2.0 website. The Regional Equity Atlas is a research and education project to promote widespread opportunity for a stronger, healthier, and more sustainable Portland-Vancouver metropolitan region. For more information, visit www.equityatlas.org. |
