Transit Access to Family Wage Jobs
As our region becomes more racially, ethnically, and age-diverse, our shared prosperity depends on our ability to create conditions that will allow everyone to flourish. This includes ensuring that all people in the region have access to employment opportunities that will enable them to meet their families’ needs. While there are a variety of factors that shape a person’s access to employment opportunities, one of the most basic factors is the ability to physically get to the available jobs. For many people, this means jobs need to be accessible by public transit.
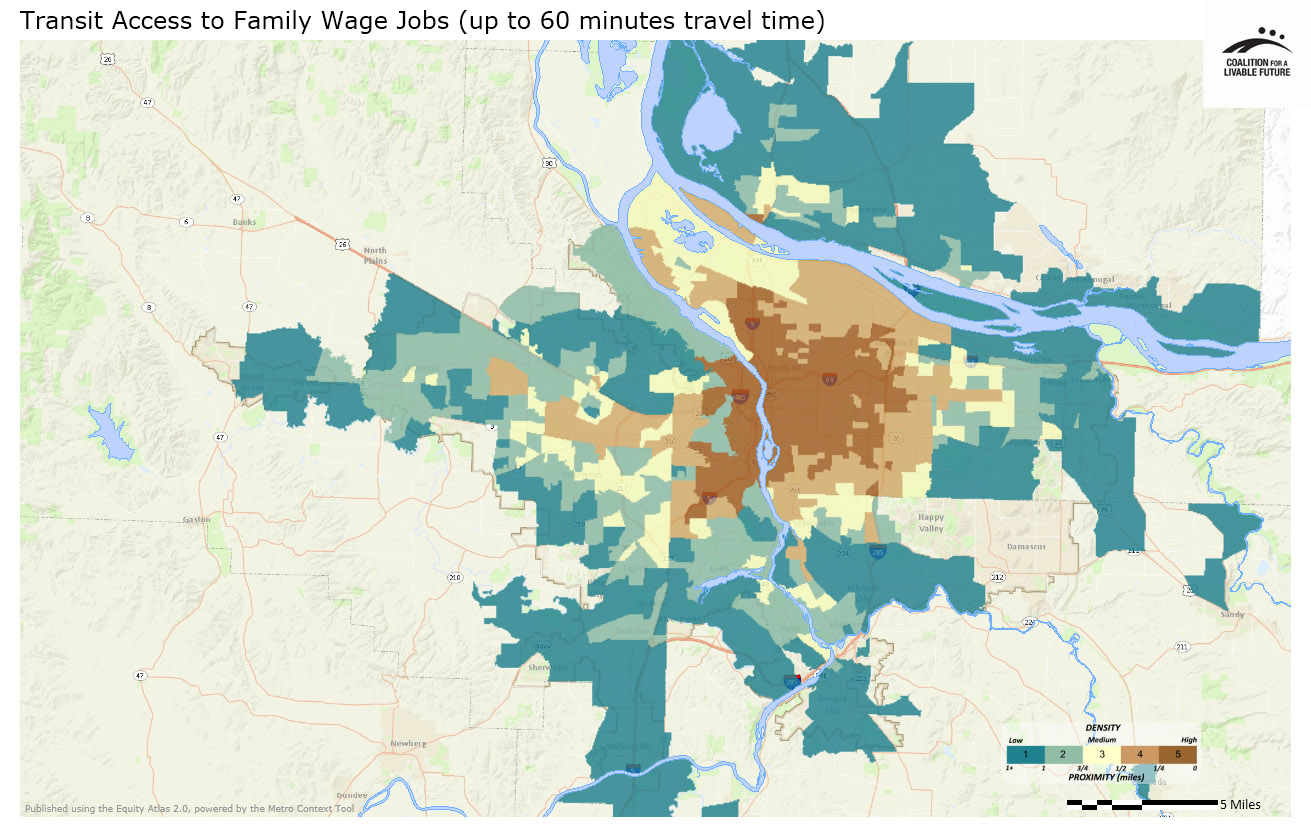
This map series shows transit access to family wage jobs, based on whether those jobs can be reached via public transit within a 60-minute commute from home. It also shows how transit access to jobs relates to the distribution of two of the populations most likely to be transit-dependent: populations of color and populations in poverty.


What the Maps Tells Us: Initial Findings
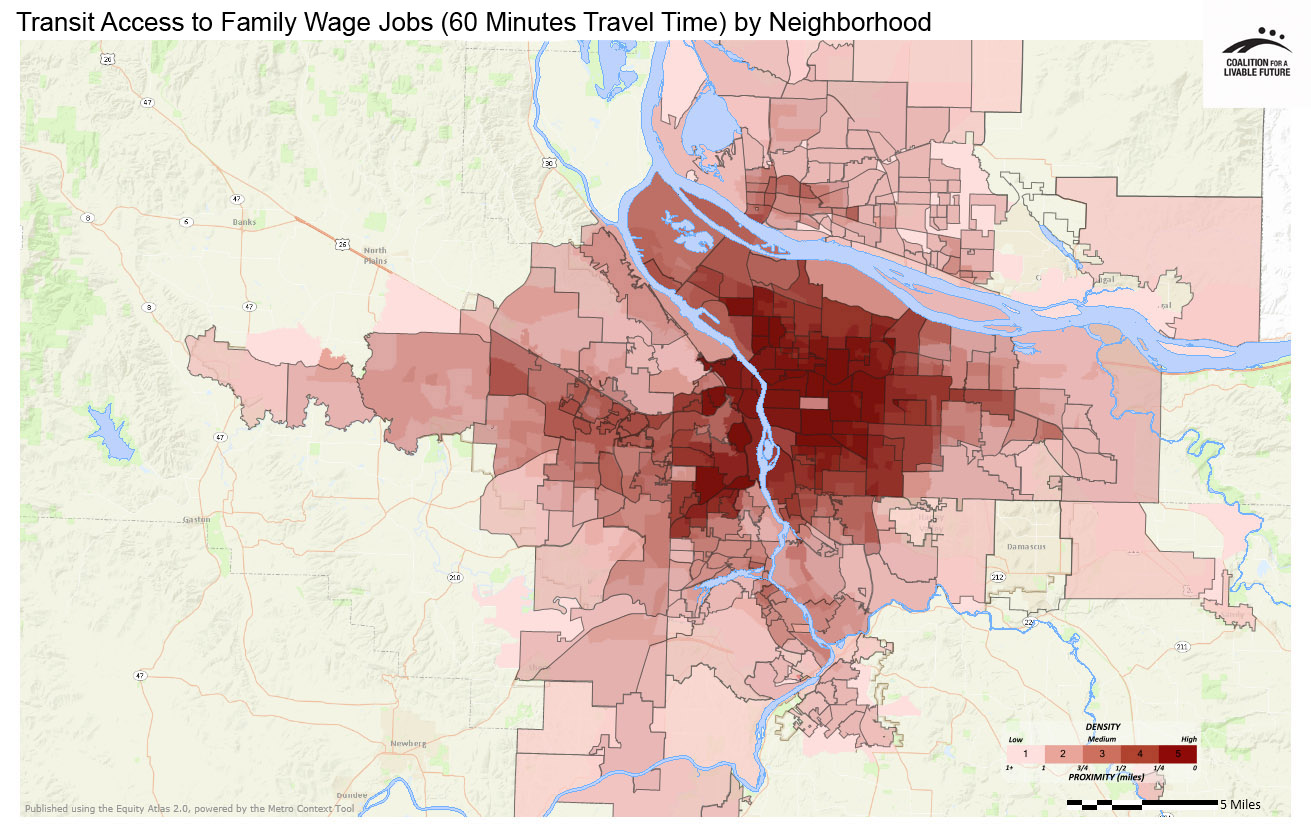
According to the Transit Access to Family Wage Jobs (60 Minutes Travel Time) by Neighborhood map, access to family wage jobs tends to be strongest in neighborhoods closer to Portland’s urban core, but there are also some areas with high levels of access in inner-ring suburban areas.
A total of 19 neighborhoods in the region earned the highest index value possible with the Transit Access (60 Minutes Travel Time) indicator, signifying that all of these neighborhoods have strong transit access to jobs that pay a family wage. All of the highest ranked neighborhoods are in Multnomah County, within Portland city boundaries:
|
Neighborhood |
Location |
|---|---|
|
Portland |
|
|
Boise/Eliot |
Portland |
|
Creston-Kenilworth |
Portland |
|
Grant Park/Hollywood |
Portland |
|
Hazelwood/Mill Park |
Portland |
|
Hollywood |
Portland |
|
Homestead |
Portland |
|
Humboldt |
Portland |
|
King |
Portland |
|
Laurelhurst |
Portland |
|
Lloyd District/Sullivan’s Gulch |
Portland |
|
Maywood Park |
Maywood Park |
|
Multnomah County Unclaimed #5 (north of Grant Park) |
Portland |
|
Multnomah County Unclaimed #6 (west of Hollywood District) |
Portland |
|
North Tabor |
Portland |
|
Richmond |
Portland |
|
Rose City Park |
Portland |
|
South Burlingame |
Portland |
|
Sullivan’s Gulch |
Portland |
Most of these high scoring neighborhoods are located east of the Willamette River and west of I-205. Two are located east of I-205 adjacent to regional job nodes -- Hazelwood/ Mill Park and Maywood Park. And two are located west of the Willamette in southwest Portland – Homestead and South Burlingame.
Ten neighborhoods in the region earned the lowest possible index value for this indicator, signifying that they have very poor transit access to family wage jobs. All ten of the neighborhoods are located in parts of Clackamas and Clark counties farther away from the urban core:
|
Neighborhood |
Location |
|---|---|
|
Barlow |
Barlow and unincorporated Clackamas County |
|
Damascus |
Damascus and unincorporated Clackamas and Multnomah County |
|
Daybreak |
Unincorporated Clark County |
|
E. Fork Frontier |
Unincorporated Clark County |
|
East Fork Hills |
Unincorporated Clark County |
|
Enterprise/Paradise Point |
Unincorporated Clark County |
|
Fern Prairie |
Unincorporated Clark County |
|
Multnomah County Unclaimed #2 (northeast Portland along Columbia River) |
Portland |
|
North Fork Lewis River |
Unincorporated Clark County |
|
Proebstel |
Unincorporated Clark County |
|
Ridgefield Junction |
Ridgefield and unincorporated Clark County |
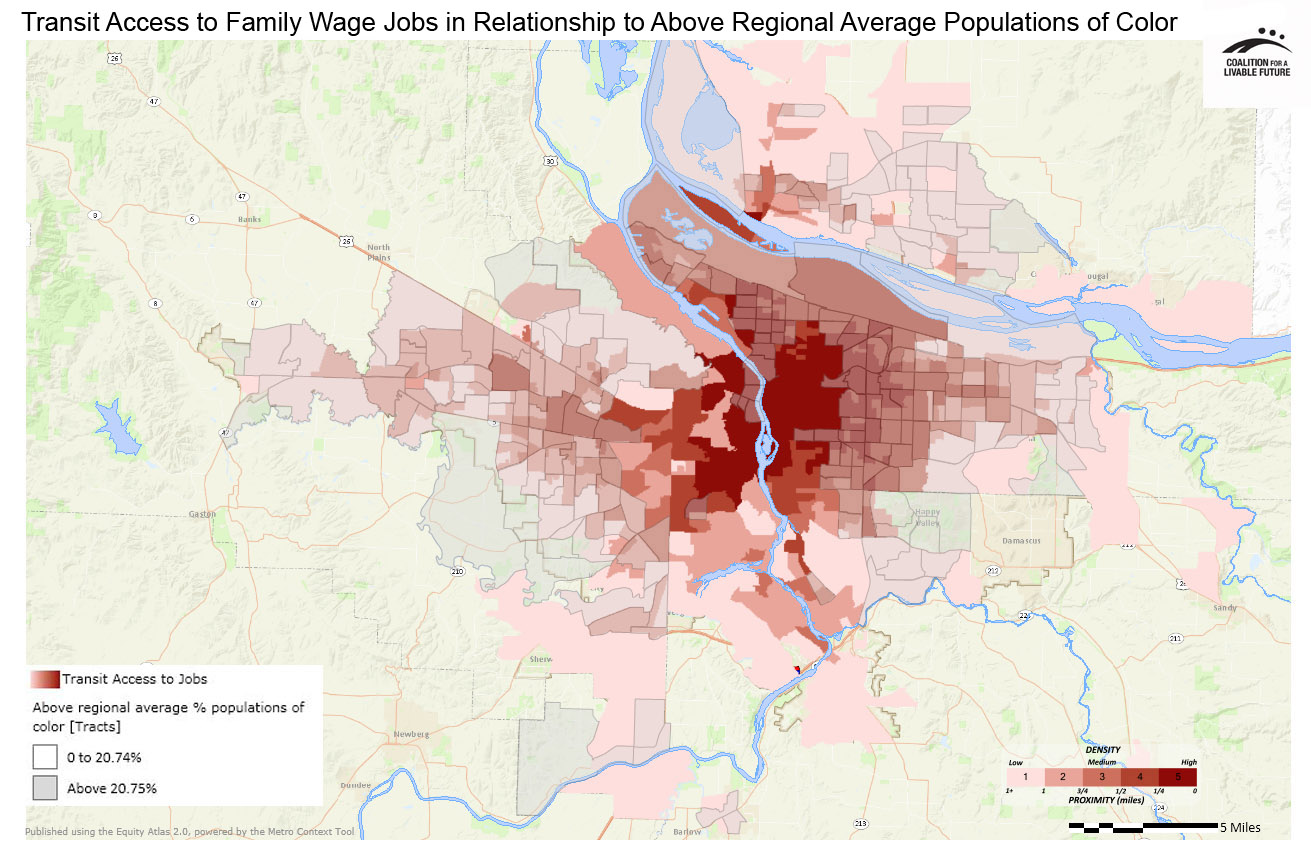
The Transit Access to Family Wage Jobs in Relationship to Areas with Above Regional Average Percent Populations of Color map suggests a significant disconnect between the areas with the highest levels of transit access to jobs and the areas where populations of color tend to live. The census tracts with percentages of populations of color that are higher than the regional average are primarily located in parts of the region outside of the neighborhoods with the highest transit access to family wage jobs. The primary exceptions to this pattern are a number of census tracts in inner north and northeast Portland as well as outer east Portland and Gresham, where the index scores are very high and the percentages of populations of color are above the regional average.
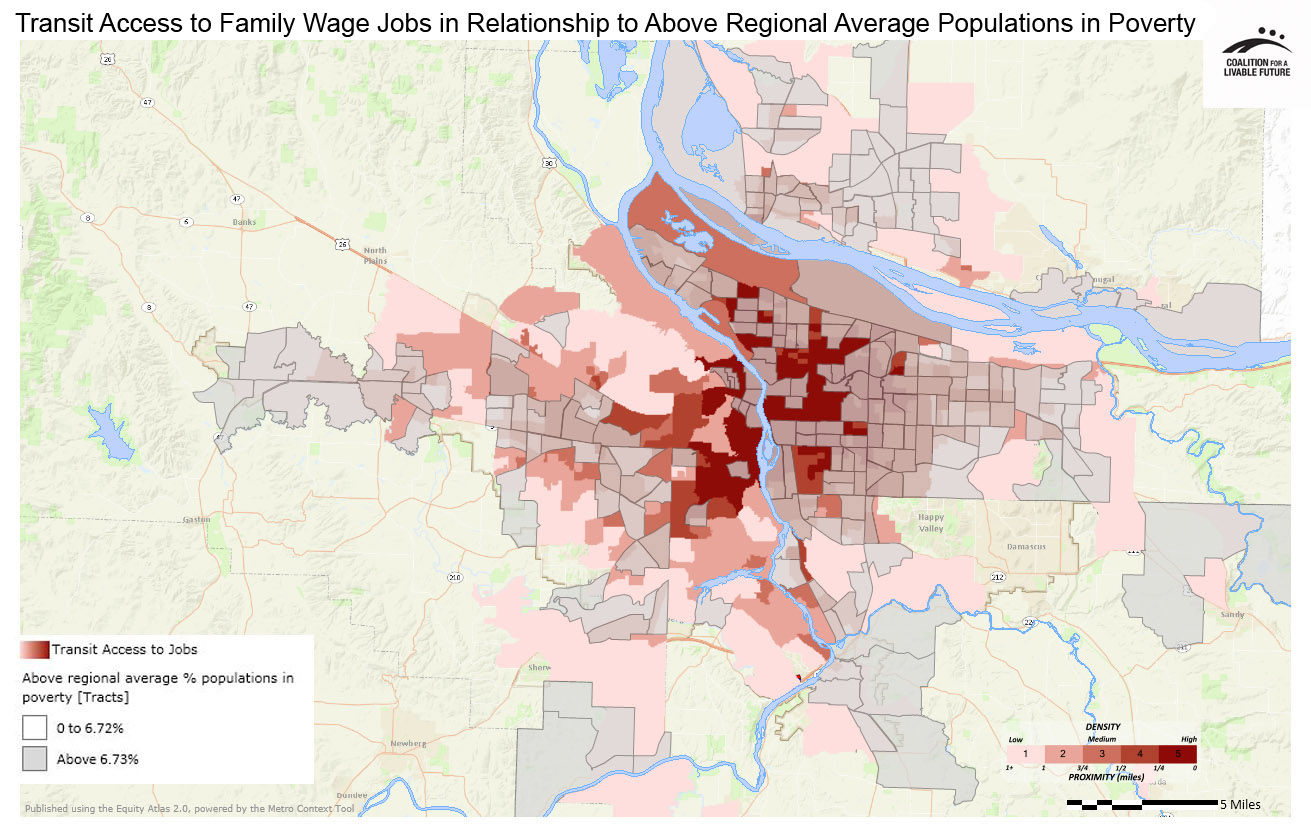
The Transit Access to Family Wage Jobs in Relationship to Areas with Above Regional Average Percent Populations in Poverty map shows a more complex pattern. There are a significant number of census tracts across the region with populations in poverty that are above the regional average and that have relatively poor transit access to family wage jobs. But there are about an equal number of census tracts where the reverse is true.
From an equity perspective, the population overlay maps help to identify key parts of the region with higher than average populations of color and/or populations in poverty and inadequate transit access to jobs. These areas could be targeted for strategic investments in transportation, job development, or other interventions to help ensure that all residents have opportunities to reach family wage jobs.
The data for this indicator are based on modeling that focuses on multi-modal transit access to jobs and does not account for bicycle or vehicle access to family wage jobs. Additionally, there is no consideration of the walkability of the pedestrian environments near the transit stops or employment locations.
It should also be mentioned that sixty minutes is a high threshold, and is a long time for a daily commute. Consequently, even neighborhoods rated as having very high access in this map might not offer desirable levels of transit access to family wage jobs.
About the Maps
Transit Access to Family Wage Jobs (60 Minutes Travel Time)
Transit access can be conceptualized as the answer to the question, "How many family-wage jobs do I have access to via transit (bus or train) within 60 minutes of travel time?" Family wage jobs are defined by the Institute of Portland Metropolitan Studies as the income level needed to support one adult, one preschooler, and one school age child. The income level varies by the county of residence: Clark ($48,172), Clackamas ($54,343), Washington ($58,915), and Multnomah ($47,244).
Data Source: Portland Bureau of Planning and Sustainability analysis of Brookings Institute data (2012)
Transit Access to Family Wage Jobs (60 Minutes Travel Time) by Neighborhood
This map uses the same underlying data as the Transit Access to Family Wage Jobs (60 Minutes Travel Time) map. Instead of showing the data as a heatmap, it aggregates the data by neighborhood. The darker the neighborhood, the higher the transit access to family wage jobs rating.
Data Source: Portland Bureau of Planning and Sustainability analysis of Brookings Institute data (2012)
Transit Access to Jobs in Relationship to Areas with Above Regional Average Populations of Color
This map layers the census tracts with percent populations of color that are above the regional average on top of the Transit Access to Family Wage Jobs (60 Minutes Travel Time) heatmap. The Transit Access to Family Wage Jobs (60 Minutes Travel Time) density layer reflects tax lot level data, while the population overlay is displayed using broader census tract-level geography.
Data Source: Portland Bureau of Planning and Sustainability analysis of Brookings Institute data (2012), American Community Survey 5-Year Estimates 2006-2010
Transit Access to Jobs in Relationship to Areas with Above Regional Average Populations in Poverty
This map layers the census tracts with percent populations in poverty that are above the regional average on top of the Transit Access to Family Wage Jobs (60 Minutes Travel Time) heatmap. The Transit Access to Family Wage Jobs (60 Minutes Travel Time) density layer reflects tax lot level data, while the population overlay is displayed using broader census tract-level geography.
Data Source: Portland Bureau of Planning and Sustainability analysis of Brookings Institute data (2012), American Community Survey 5-Year Estimates 2006-2010
*Some neighborhood boundaries overlap. The Atlas refers to the areas within the overlapping boundaries by the names of both neighborhoods.
|
This document was downloaded from the Map Series library of the Coalition for a Livable Future’s Regional Equity Atlas 2.0 website. The Regional Equity Atlas is a research and education project to promote widespread opportunity for a stronger, healthier, and more sustainable Portland-Vancouver metropolitan region. For more information, visit www.equityatlas.org. |
