School Achievement Levels
This map series depicts the achievement levels at the region’s schools. It includes maps on Adequate Yearly Progress and 3rd grade reading levels, as well as maps that layer this achievement information with data on poverty and race.
If should be noted that while achievement data provide some information about the educational experience of students in a school, achievement levels offer only a limited measure of educational quality. Achievement data are based on standardized tests, which have been criticized for various reasons including cultural bias and providing an insufficient measure of student learning. Furthermore, research has shown that achievement levels are as much a reflection of the socioeconomic status of the students in a school as they are of teaching quality.
What the Maps Tell Us: Initial Findings
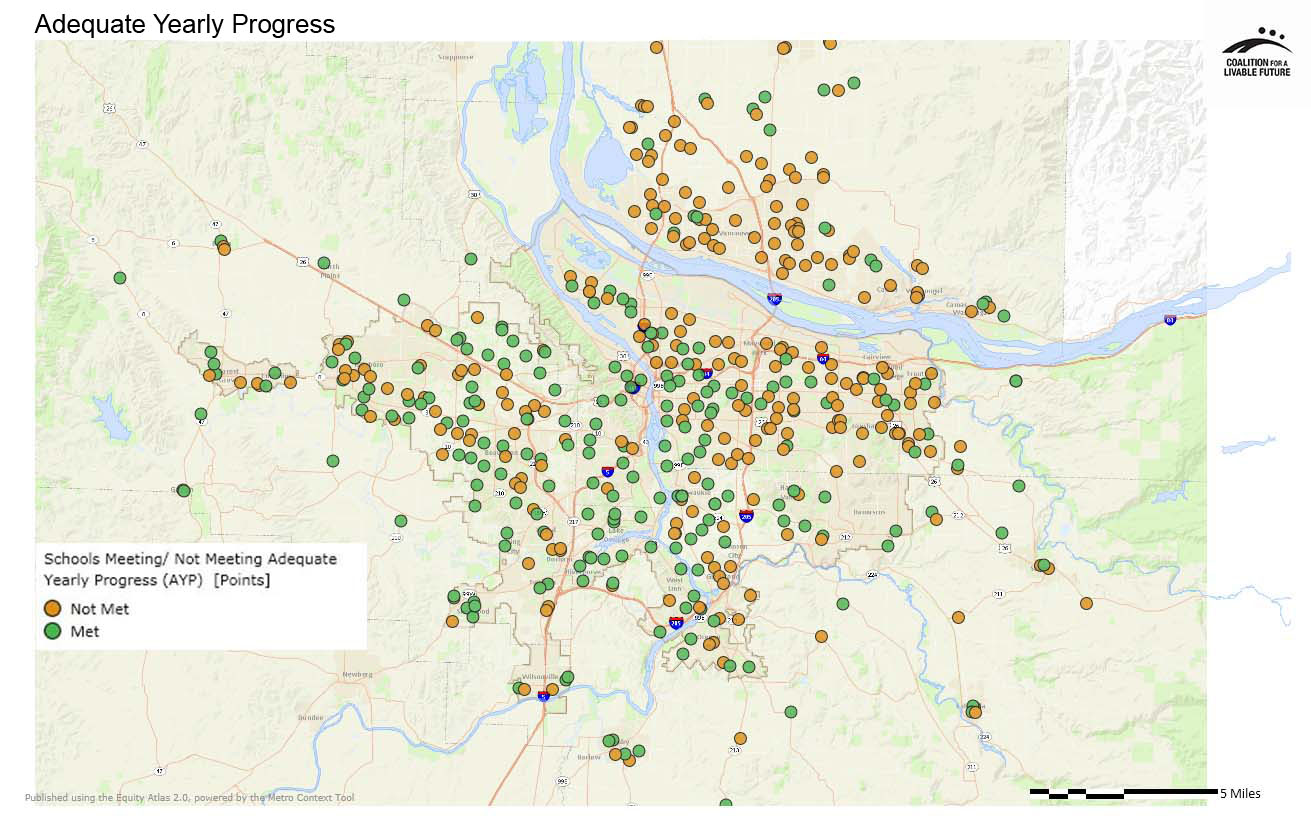
The Adequate Yearly Progress (AYP) map shows that schools that met federally mandated achievement benchmarks in the 2011-12 academic year are generally dispersed throughout the region, with no clear spatial pattern. There are some discernible concentrations of schools meeting AYP in the central eastside of Portland, the west hills, various locations throughout Washington County, and suburbs to the south like Lake Oswego, Milwaukie and West Linn. The most noticeable groupings of schools that did not meet AYP can be found throughout Clark County as well as areas in the eastern part of Multnomah County such as outer east Portland, Gresham, Wood Village, Maywood Park and Troutdale.
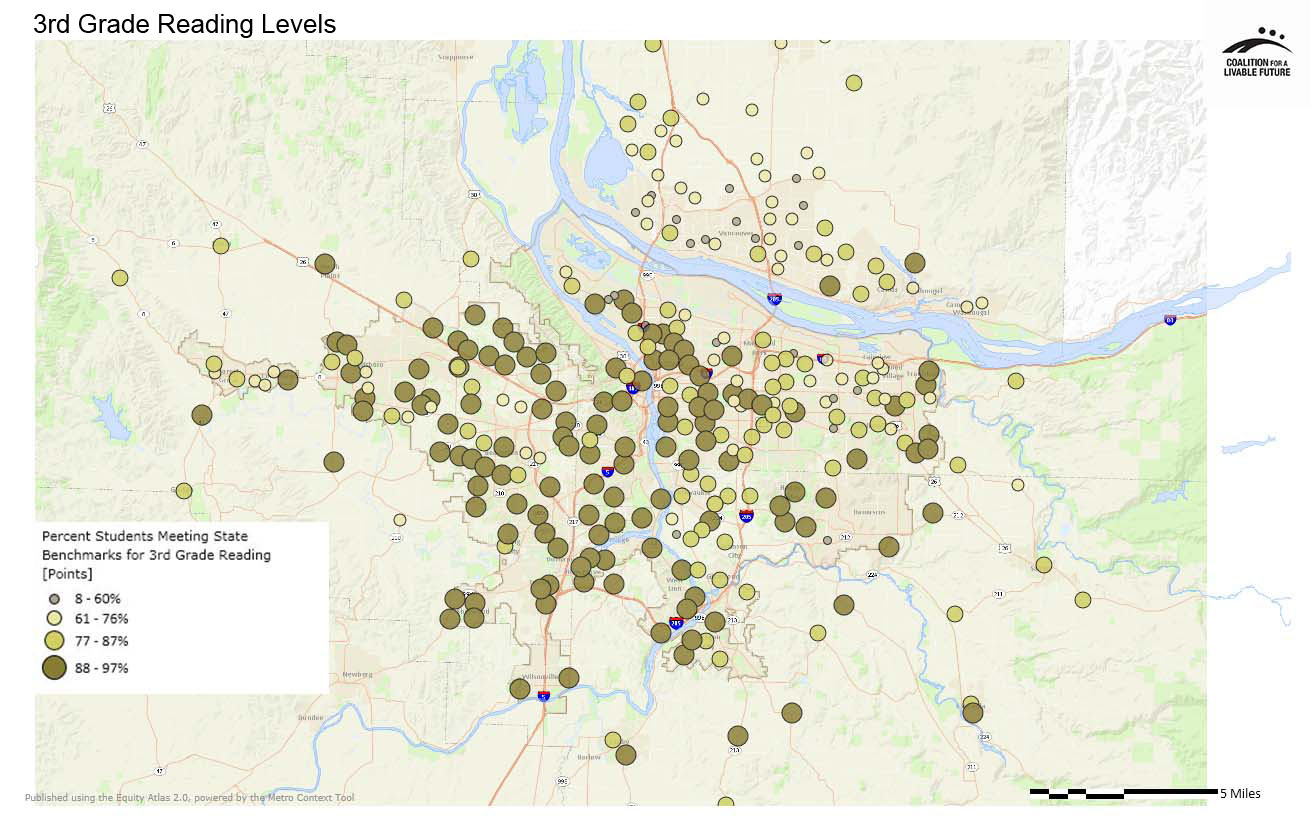
The 3rd Grade Reading Levels map shows the percentage of students meeting state third grade reading benchmarks, which is viewed by many experts as a critical indicator of future educational success. Fisher’s Landing Elementary School in Vancouver had the highest percentage of students meeting third grade reading benchmarks with 96.6%, and almost 70 schools tied for 2nd place with 95% of students meeting the benchmark. These schools are scattered throughout Multnomah, Clackamas, and Washington counties, but are especially concentrated in the parts of the three counties that are closest to the urban core.
Research has shown that the percentage of students meeting third grade reading benchmarks tends to correlate with school socioeconomic status. Within this context, it is noteworthy that Naas Elementary School in Boring, which was among the ten schools in the region with the highest percentages of students eligible for free or reduced price lunch in the 2011-12 school year, had 95% of its students meeting the third grade reading benchmarks. Similarly, Portland Public Schools’ Humboldt Elementary, which was among the ten schools in the region with both the highest percentages of students eligible for free or reduced price lunch and the highest percentages of minority students in the 2011-12 school year, had 90.9% of its students meeting third grade reading benchmarks. (Note: The data for this analysis come from the 2011-12 school year; Portland Public Schools closed Humboldt Elementary in June 2012.)
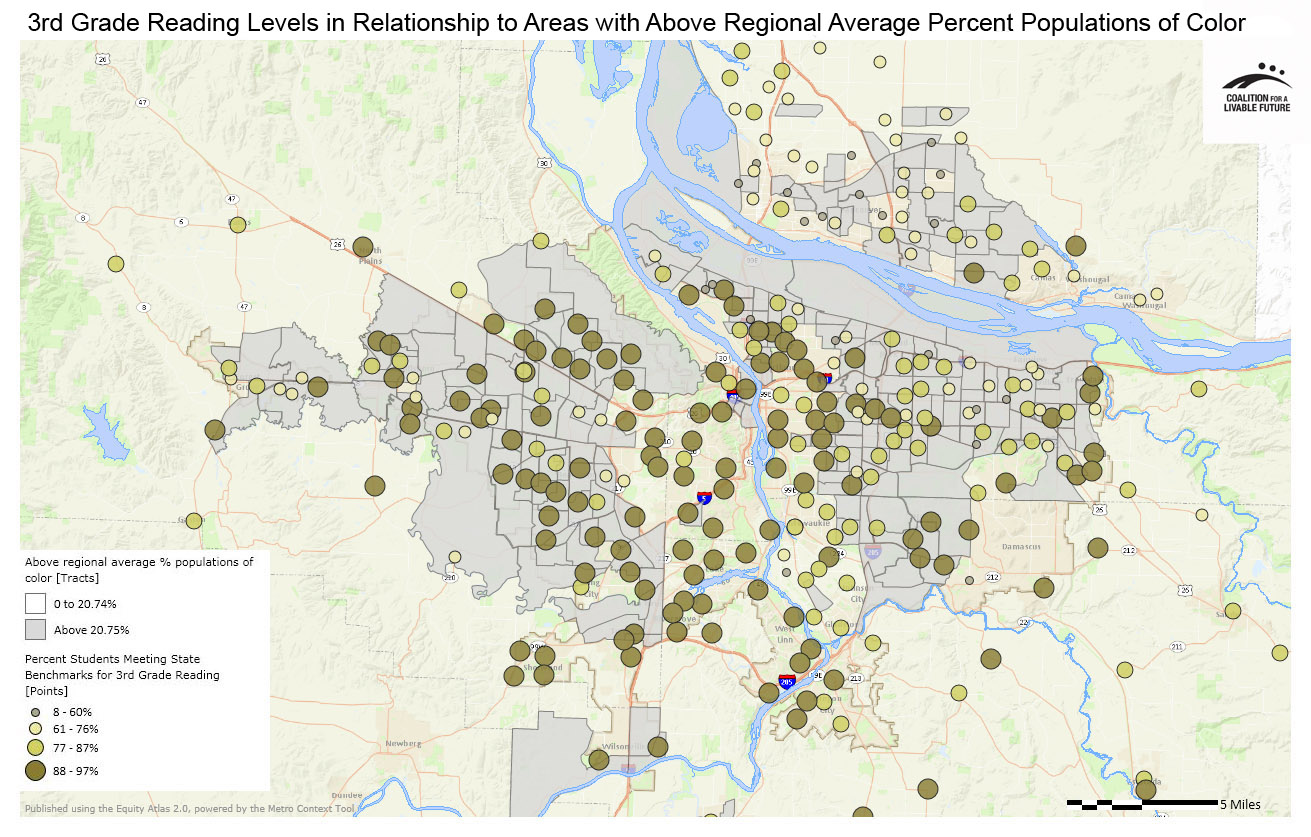
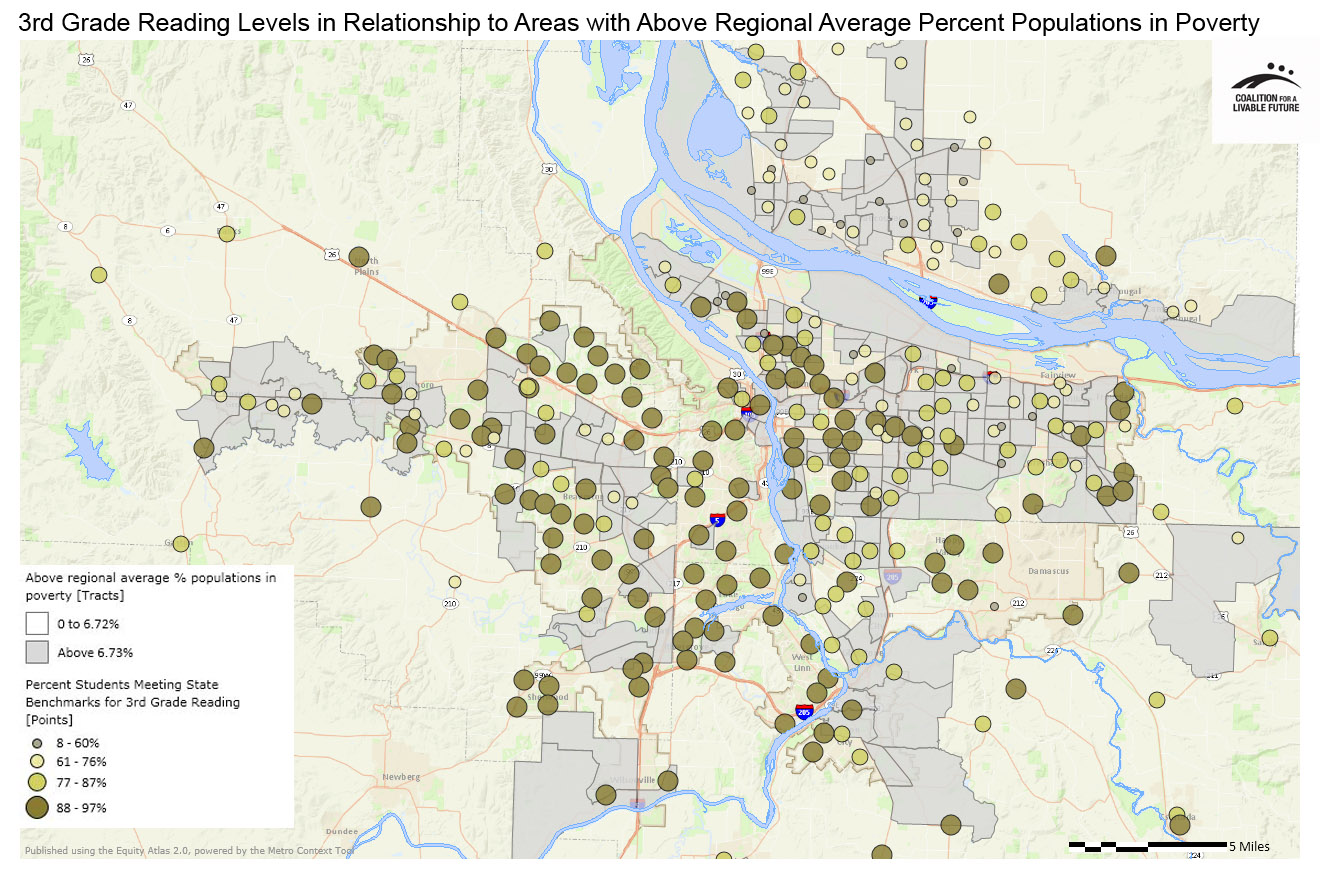
Another lens through which to assess the relationship between student achievement levels and socioeconomic status is to compare school achievement data with the demographics of the surrounding community. A visual scan of the 3rd Grade Reading Levels in Relationship to Areas with Above Regional Average Percent Populations of Color map and the 3rd Grade Reading Levels in Relationship to Areas with Above Regional Average Percent Populations in Poverty map does not reveal any over-arching regional patterns. As one might expect, there is a slight tendency for higher performing schools to be located in census tracts with lower rates of poverty and populations of color. But the pattern is not uniform. Quite a few schools with high percentages of students meeting third grade reading benchmarks are located in census tracts with populations in poverty and populations of color above the regional average. And quite a few schools with low percentages of students meeting third grade reading benchmarks are located in census tracts with populations in poverty and populations of color below the regional average. For example, out of the ten schools with the lowest percentages of students meeting third grade reading benchmarks, seven have populations in poverty and populations of color above the regional average, while three do not.
Given that census tracts do not neatly align with school catchment areas, additional research is needed to fully understand the relationship between third grade reading levels and the demographics of the surrounding community. The Atlas mapping tool provides additional data that can be overlaid with the third grade reading level data to further illuminate these patterns.
About the Maps
Adequate Yearly Progress
This map depicts whether or not schools have met Adequate Yearly Progress (AYP) standards as required by the No Child Left Behind Act. Many critiques have been made of the AYP model, but AYP data are the only student performance data currently available in a consistent format across schools, which is why these data are included in the Atlas. While the data provide some useful information, any interpretation of the data should be informed by the following caveats: (1) The standardized tests that are the basis for the AYP assessment have been criticized for various reasons including cultural bias and providing an insufficient measure of student learning; (2) Test scores are as much a reflection of the socioeconomic status of the students in a school as they are of teaching quality; (3) The AYP model itself has been criticized as flawed.
Data Source: Oregon Department of Education and Washington Office of the Superintendent of Public Instruction, 2011-12
3rd Grade Reading Levels
This map depicts the percentage of students meeting or not meeting state benchmarks for third grade reading achievement. These data utilize results from standardized testing, which means that they are subject to the same limitations as the Adequate Yearly Progress data.
Data Source: Oregon Department of Education and Washington Office of the Superintendent of Public Instruction, 2011-12
Schools with 75% or More of Students Eligible for Free or Reduced Price Lunch in Relationship to Adequate Yearly Progress
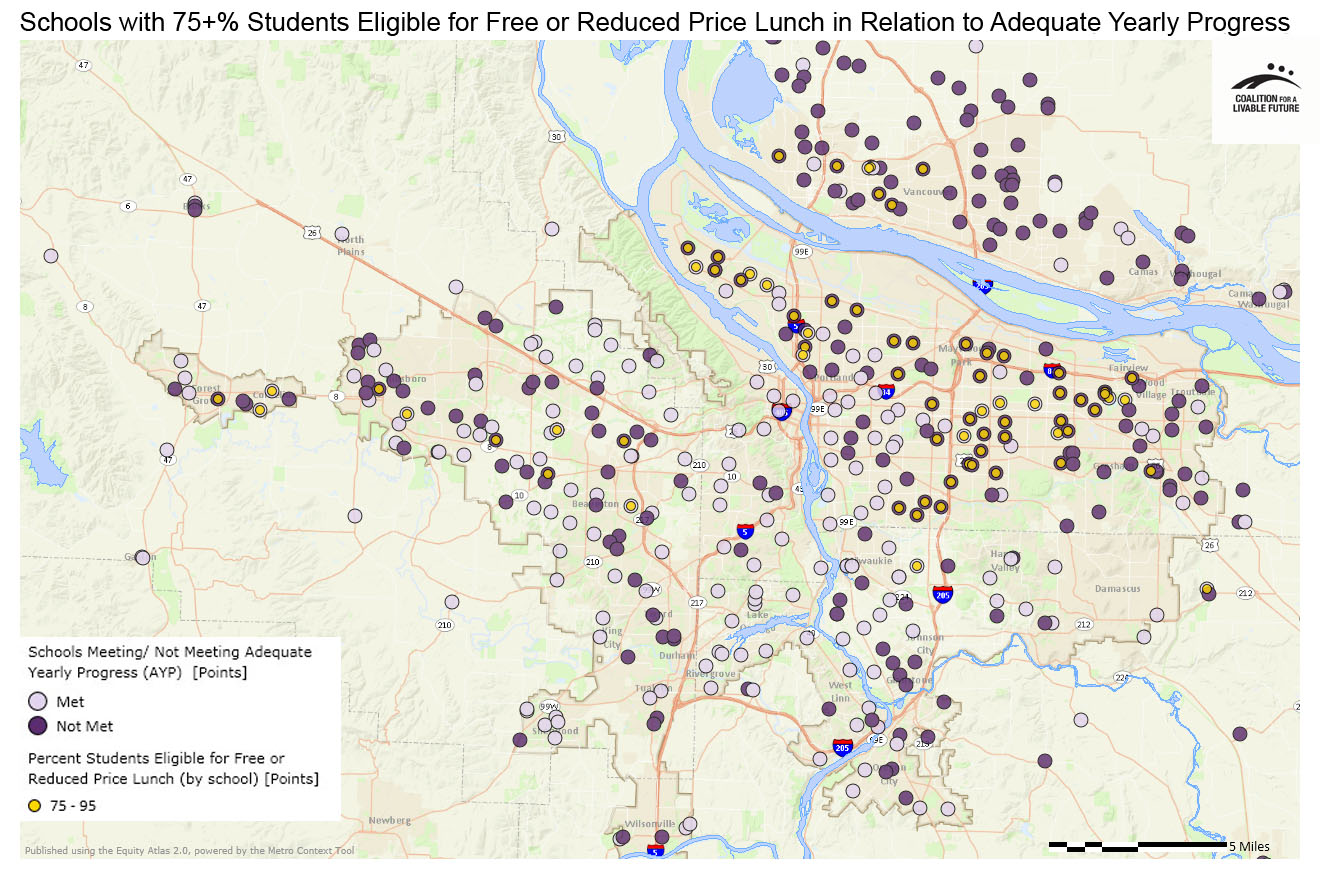
This map layers the Percent Students Eligible for Free or Reduced Price Lunch by school point layer on top of the Adequate Yearly Progress map. The Percent Students Eligible for Free or Reduced Price Lunch map has been modified to highlight schools with 75% or more eligible students.
Data Source: Oregon Department of Education and Washington Office of the Superintendent of Public Instruction, 2011-12
3rd Grade Reading Levels in Relationship to Areas with Above Regional Average Percent Populations of Color
This map layers the 3rd Grade Reading Levels map with a map showing census tracts with above regional average percent populations of color.
Data Source: American Community Survey 5-Year Estimates 2006-2010, Oregon Department of Education and Washington Office of the Superintendent of Public Instruction, 2011-12
3rd Grade Reading Levels in Relationship to Areas with Above Regional Average Percent Populations in Poverty
This map layers the 3rd Grade Reading Levels map with a map showing census tracts with above regional average percent populations in poverty.
Data Source: American Community Survey 5-Year Estimates 2006-2010, Oregon Department of Education and Washington Office of the Superintendent of Public Instruction, 2011-12
|
This document was downloaded from the Map Series library of the Coalition for a Livable Future’s Regional Equity Atlas 2.0 website. The Regional Equity Atlas is a research and education project to promote widespread opportunity for a stronger, healthier, and more sustainable Portland-Vancouver metropolitan region. For more information, visit www.equityatlas.org. |
