Immigrants
In an equitable region, all people are able to benefit from the opportunities the region provides. However, immigrant communities often face significant obstacles that limit their ability to meet their basic needs and advance their health and well being. These obstacles stem from language and cultural barriers as well as racism and discrimination. Understanding the disparities affecting immigrants’ access to resources and opportunities is essential as part of any comprehensive analysis of regional equity.
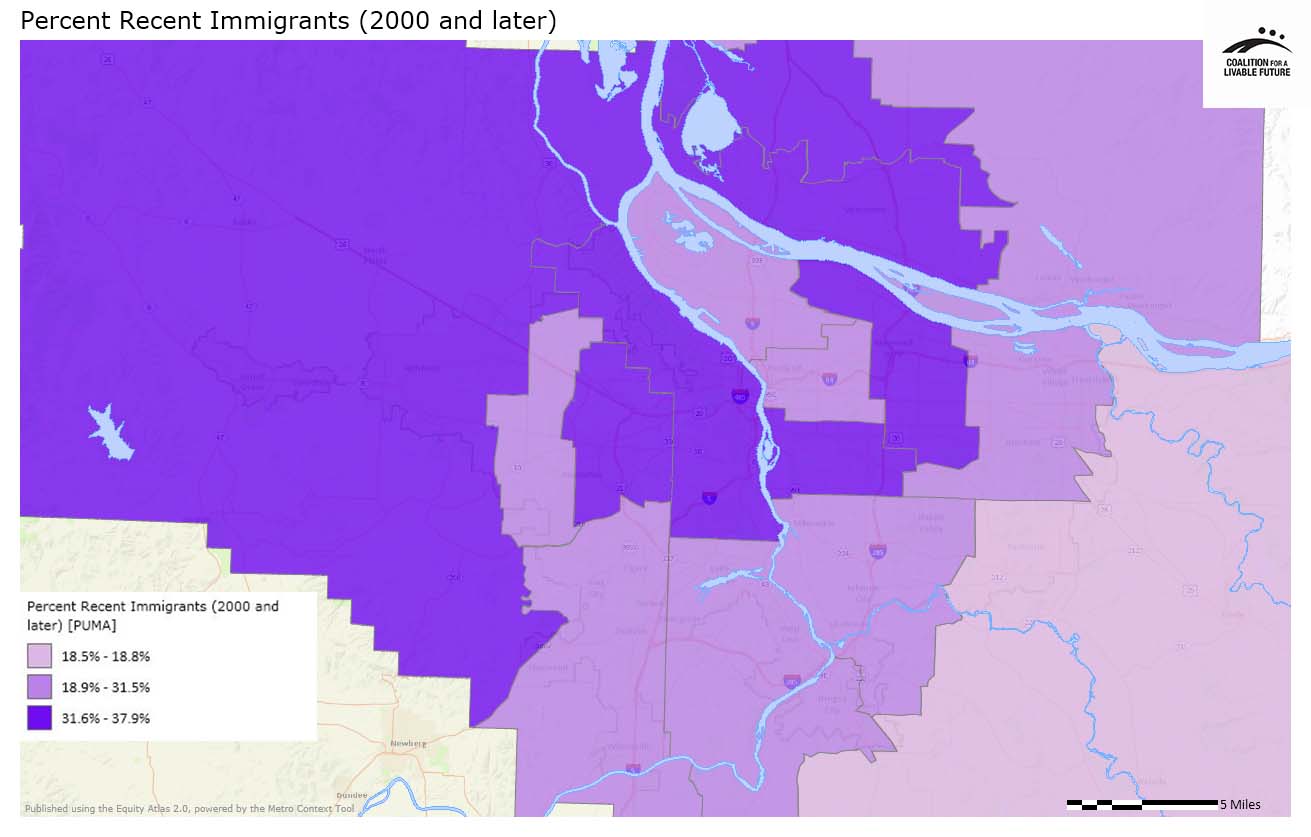
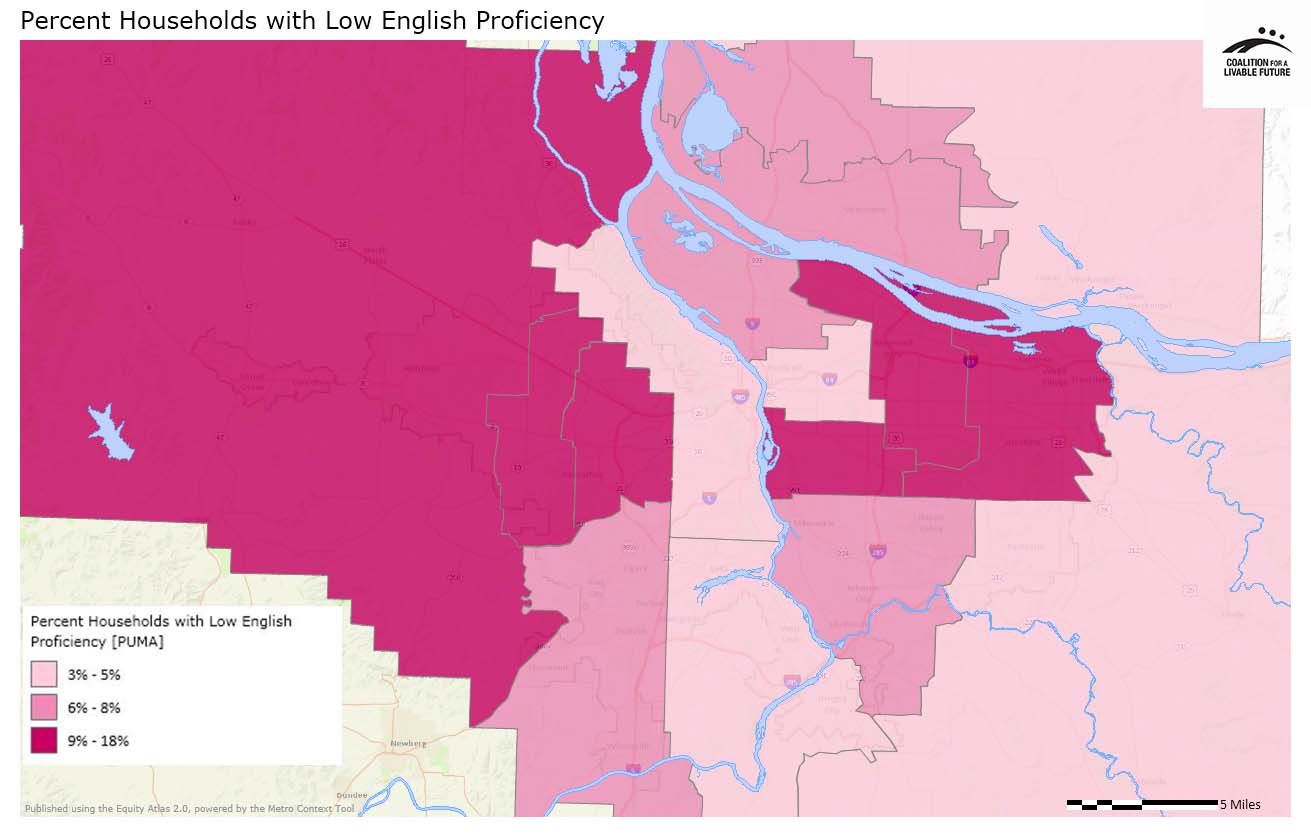
Data are available through the American Community Survey to enable us to map the immigrant population, but the sample sizes for the data are too small to permit us to map the data at a very granular level. The maps in this series show (a) the percent of recent immigrants (defined as those who came to the United States in 2000 or later), and (b) the percent of households who self-identify as having low English proficiency. Both maps are depicted at the PUMA (Public Use Microdata Area) level, which can be used to show general regional patterns, but isn’t fine-grained enough to provide meaningful insights into patterns of inequity affecting immigrants.


What the Maps Tell Us: Initial Findings
As indicated above, the usefulness of these maps is constrained by the fact that the data are aggregated at a large geographic scale, making fine-grained analyses difficult. However, it is interesting to compare the two maps -- Percent Recent Immigrants (2000 and Later) and Percent Households with Low English Proficiency -- to see where they converge and diverge. One might expect them to be nearly identical, but they are not. For example, a high income area that includes the west hills in Portland and Washington County has a high concentration of recent immigrants (33.2%) but a high level of English proficiency (an estimated 4% of the population does not speak English). In contrast, the mid-Multnomah County area that includes most of the city of Gresham has a moderately high concentration of recent immigrants (31.5%) but a lower level of English proficiency (an estimated 12.4% of the population does not speak English).
These maps should be used with caution, as they provide a single statistic for large areas which may actually have significant variations within them. However, it is possible to use the maps in conjunction with more granular information to identify potential patterns for future research. For example, comparing the Percent Students Eligible for Free or Reduced Price Lunch map to the English proficiency map shows that higher poverty schools tend to be located in areas with a greater proportion of residents with limited English proficiency.
About the Maps
The maps in this series are based on American Community Survey data. Because of sample size issues, the margin of error tends to be quite high when disaggregating ACS data. Because of this, the immigrant indicators are mapped at the PUMA level -- a relatively coarse geographic unit, but one where the margins of error are at an acceptable level. The maps can be used to discern general regional patterns only. Additionally, immigrant populations are likely to be under-represented in American Community Survey data due to a range of factors including language barriers and distrust of government among some immigrant groups.
Percent Recent Immigrants (2000 and Later)
This map shows the percent of the population that is foreign-born with a year of entry of 2000 or later. Foreign born includes both naturalized citizens and non-citizens.
Data Source: American Community Survey (ACS); DP02 Selected Social Characteristics; Universe = Total Population, American Community Survey 5-Year Estimates (2006-2010)
Percent Households with Low English Proficiency
This map shows the percent of the population over 5 years old with low levels of English-language proficiency. Low English proficiency is determined through a ranked question that asks whether a person can speak English very well to none at all. The Percent Households with Low English Proficiency map shows the population over age 5 that answered that they speak English “not at all” or “less than very well” on the American Community Survey questionnaire.
Data Source: American Community Survey (ACS); DP02 Selected Social Characteristics; Universe = Total Population over 5 Years Old, American Community Survey 5-Year Estimates (2006-2010)
|
This document was downloaded from the Map Series library of the Coalition for a Livable Future’s Regional Equity Atlas 2.0 website. The Regional Equity Atlas is a research and education project to promote widespread opportunity for a stronger, healthier, and more sustainable Portland-Vancouver metropolitan region. For more information, visit www.equityatlas.org. |
