Household Composition
Understanding the different household compositions of the region’s population is important to any analysis of regional equity. People’s priorities and needs are determined in part by their household type. For example, families with children may have different needs than individual adults, and single parent families may have different priorities than families with two parents. Some household types may also be more likely to experience disparities than others. For example, national studies indicate that single parent households are more likely to live in poverty than two parent households.
The maps in this series show the density per acre of different household types, including (a) families with children, (b) single parent families, and (c) households with no children. The maps provide insights into how various household types are distributed across the region. They also provide useful analytical insights when viewed in combination with other Atlas maps. For example, how do housing affordability patterns affect the distribution of single parent families and households with children? How does the distribution of households with children compare with the distribution of resources and amenities that are particularly essential for those households?


What the Maps Tell Us: Initial Findings
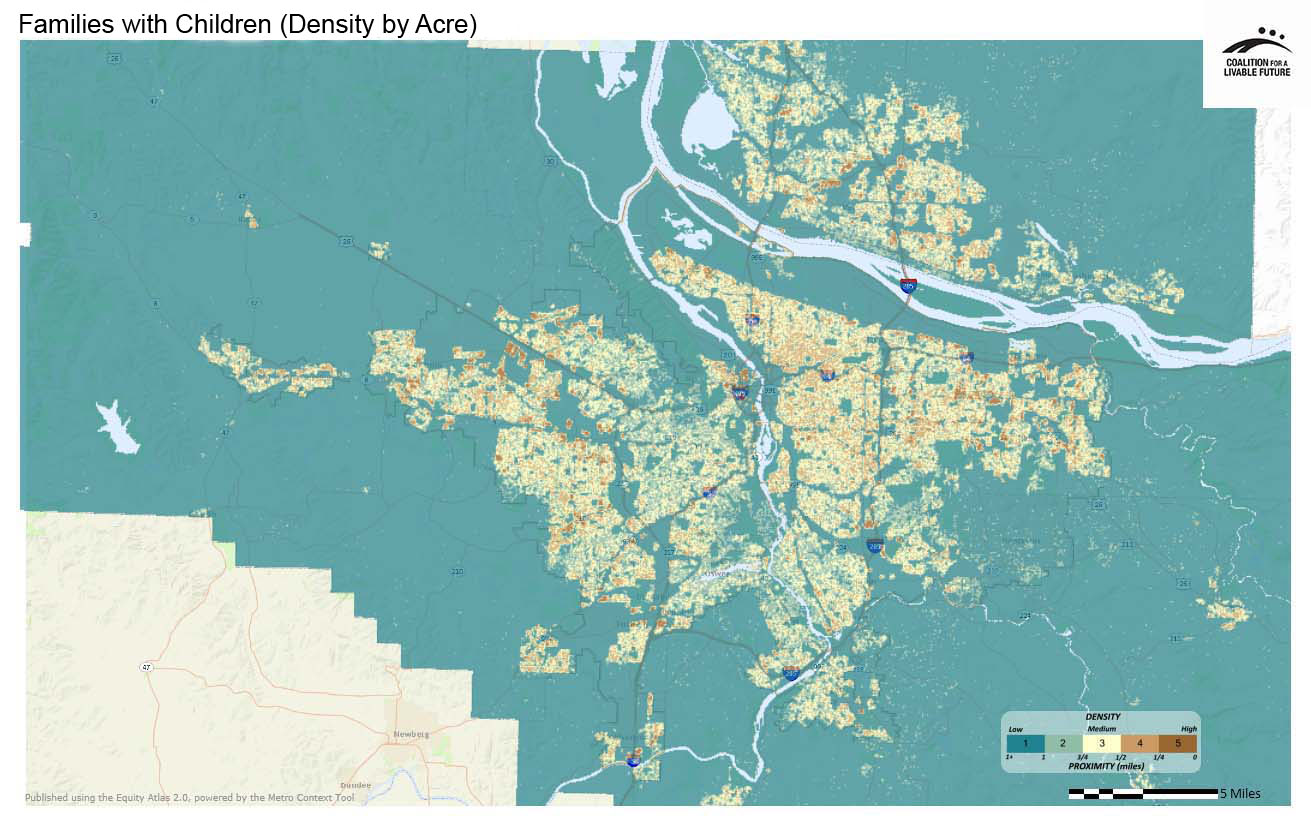
Families with children live throughout the four-county region. The map Families with Children (Density by Acre) shows three kinds of spatial patterns: scattered hotspots with high densities of families with children, large areas with moderate densities of families with children, and areas with relatively low densities of families with children. In Clark County, dense clusters of families with children are found along State Road 500. In the three Oregon counties, areas with high densities of families with children tend to be located in eastern Multnomah County and western Washington County. Much of inner east Portland has a moderate density of families with children. West of the Willamette River, the area bounded by 217, I-5 and I-205 has a relatively low density of households with children.
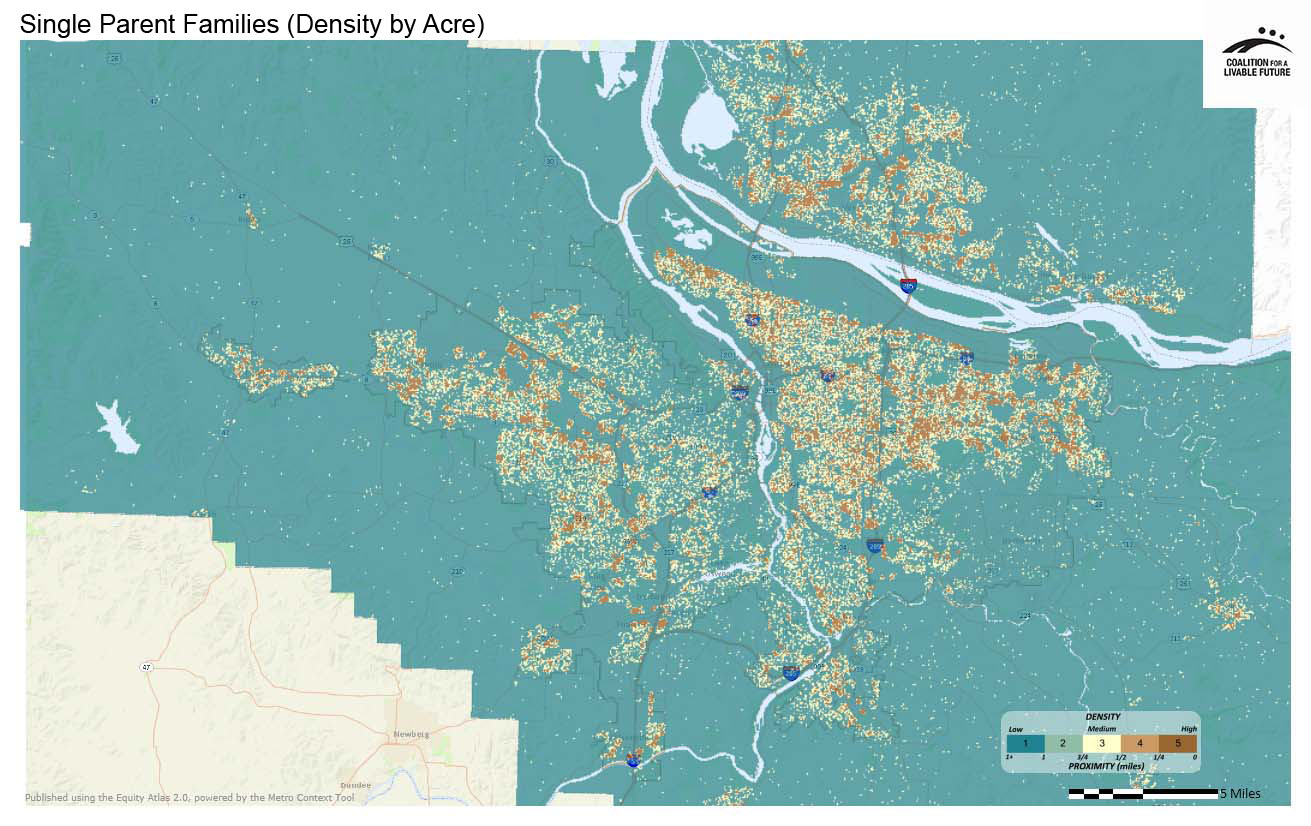
The map Single Parent Families (Density by Acre) indicates that single-parent families are also distributed throughout the region. Denser concentrations of these households are found in and around the Bagley Downs neighborhood in Vancouver, the Portsmouth neighborhood in north Portland, the Powellhurst-Gilbert neighborhood in outer east Portland, the Rockwood and Mount Hood neighborhoods in Gresham, the Central Beaverton neighborhood, the Aloha neighborhood in unincorporated Washington County and downtown Hillsboro.
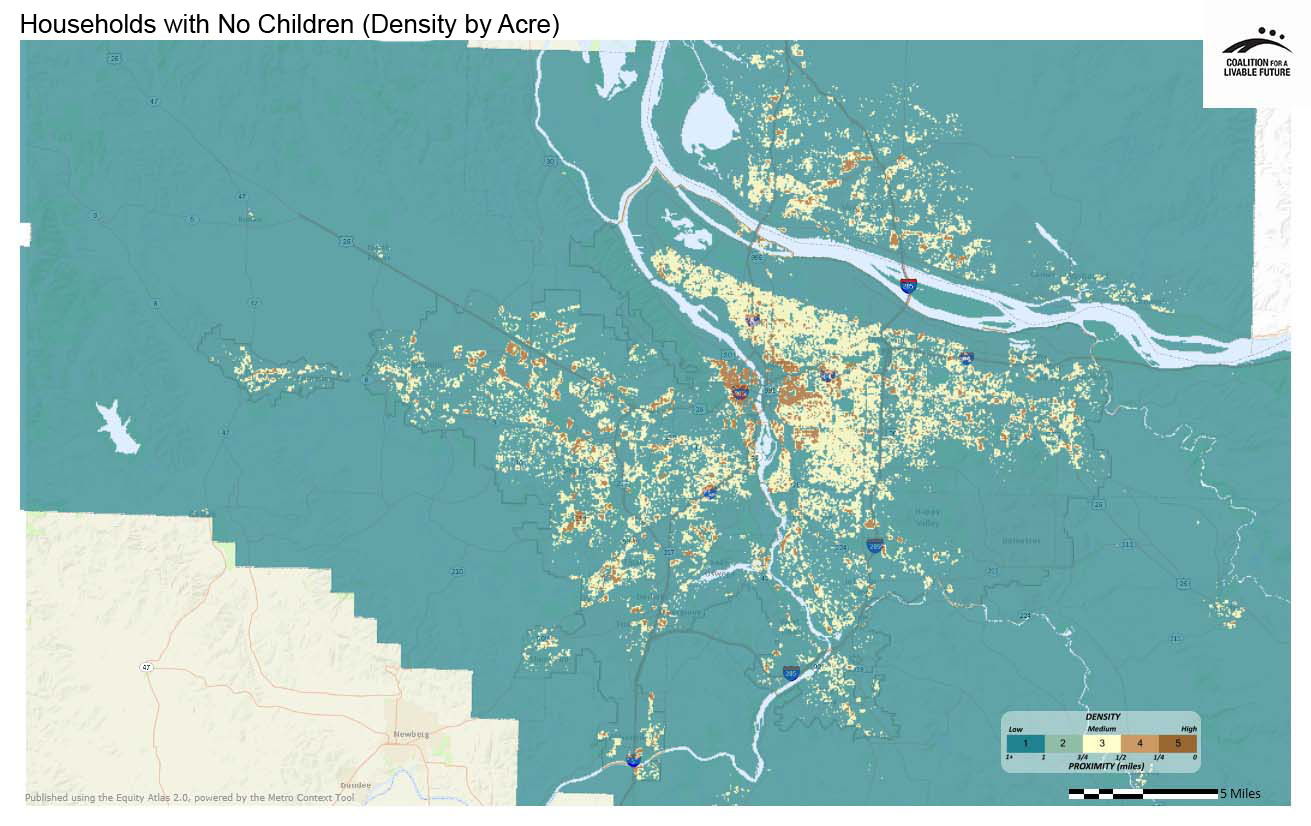
In contrast, according to the Households with No Children (Density by Acre) map, households without children are concentrated in a few areas, most of which are in Portland. The region’s largest concentration of households without children is found in an area comprised of downtown Portland, the Pearl District, the Northwest District and Goose Hollow. Households without children are also clustered in the adjacent inner southeast neighborhoods of Buckman, Kerns and Sunnyside, and the inner northeast neighborhoods of Irvington and Sullivan’s Gulch. In Washington County, smaller clusters are also found in east Hillsboro and throughout Beaverton.
These maps can help organizations that offer services for specific kinds of households to geographically target outreach and program delivery. The maps may also be useful to school districts, park planners and other public agencies in planning their investments and services. From an equity perspective, the maps can be analyzed in combination with other Atlas maps to assess how the distribution of key resources and opportunities compares with the distribution of different household types across the region.
About the Maps
These maps show the density of different household types by acre based on Census 2010 data.
Families with Children (Density by Acre)
This map shows the density of households with children per acre.
Data Source: U.S. Census 2010 (P19 Household Type); Universe = Total Households
Households with No Children (Density by Acre)
This map shows the density of households with no children per acre.
Data Source: U.S. Census 2010 (P19 Household Type); Universe = Total Households
Single Parent Families (Density by Acre)
This map shows the density of single parent family households per acre.
Data Source: U.S. Census 2010 (P19 Household Type); Universe = Total Households
Note:
When using the Atlas online mapping tool, it is important to remember that the density measurements in the tool are relative rather than absolute (or standardized). For instance, a rating of “5” on the Families with Children heatmap might not necessarily represent the same number or percentage of people as a rating of “5” on the Single Parent Families heatmap. What this means is that you can use the statistics to compare the relative densities of the families with children across different geographic areas, but you cannot use the "1" to "5" scores to compare the actual numbers of families with children with the actual numbers of single parent families in a geographic area.
|
This document was downloaded from the Map Series library of the Coalition for a Livable Future’s Regional Equity Atlas 2.0 website. The Regional Equity Atlas is a research and education project to promote widespread opportunity for a stronger, healthier, and more sustainable Portland-Vancouver metropolitan region. For more information, visit www.equityatlas.org. |
