Bikability
Neighborhoods that provide safe, effective bicycle routes help to foster and promote an important active transportation option. Bicycling has many valuable health benefits, including increased physical activity and reduced vehicle emissions when bicycling is used as an alternative to driving. Bicycling can also complement other active transportation options by enhancing access to essential resources and opportunities that are not on transit lines or within comfortable walking distance.
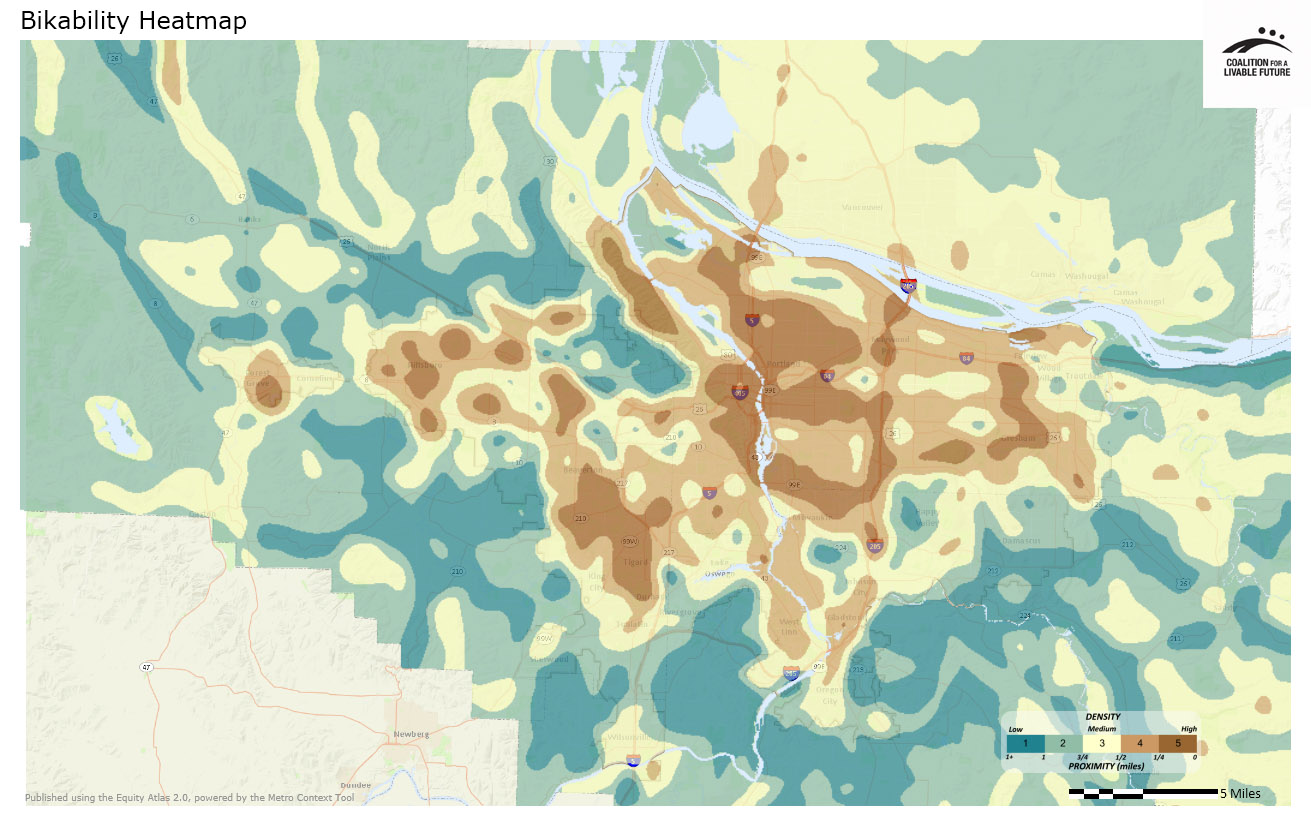
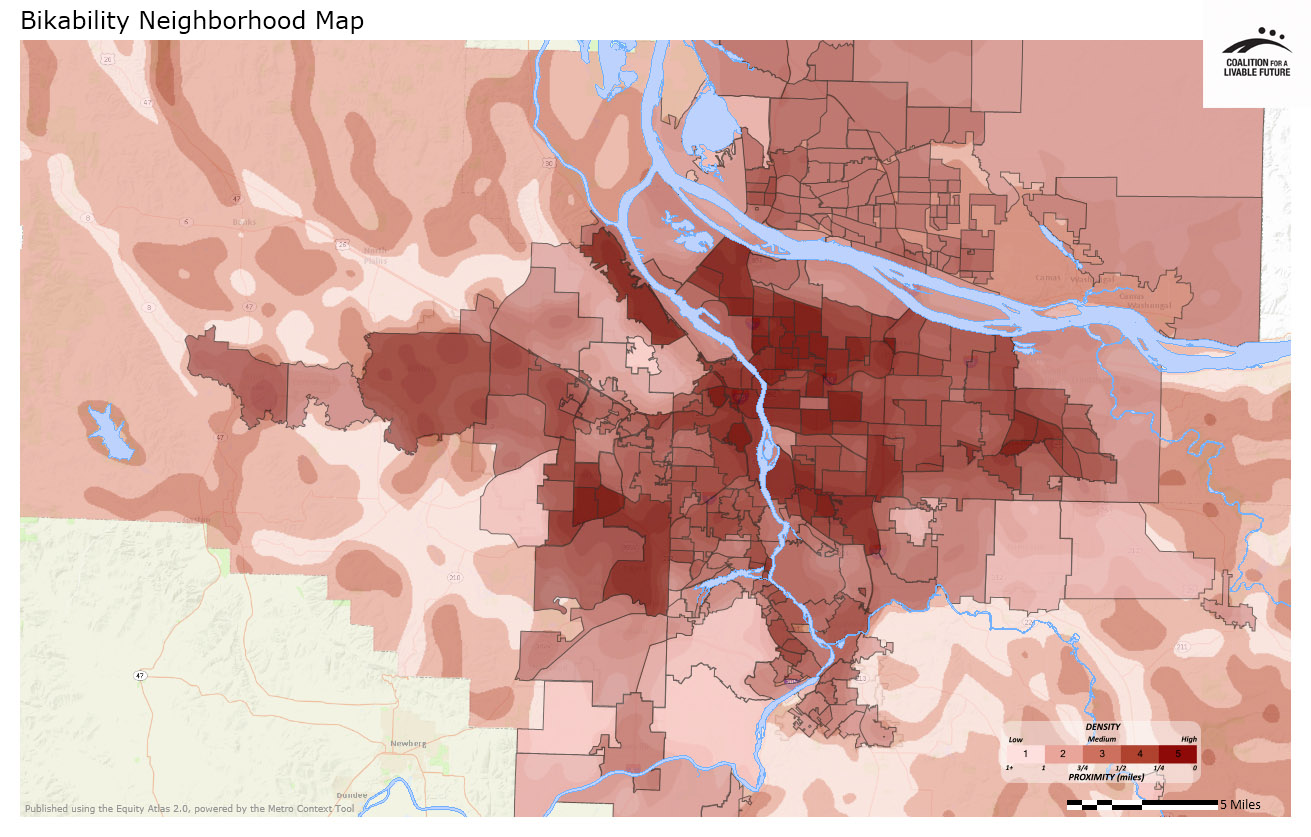
This series includes a map showing the bikability of different locations around the region, and a map that summarizes bikability by neighborhood.


What the Maps Tell Us: Initial Findings
The Bikability Heatmap shows that the areas with the best coverage of routes that are suitable for biking (the darkest brown areas) are located in Portland’s central city, parts of Gresham, Tigard, Beaverton, Hillsboro, and Forest Grove. Areas with reasonably good bike route coverage (lighter brown areas) include portions of Portland, Gresham, Tigard, Beaverton, Hillsboro, Forest Grove, West Linn, and Gladstone. Small sections of Vancouver along I-5 and I-205, as well as a few small areas in unincorporated Clackamas and Washington counties also have reasonably good access to bike routes (lighter brown areas).
The Atlas mapping tool can be used to assign a score to every neighborhood in the region based on access to bike routes. A score of “5” indicates high access and a score of “1” indicates low access. According to the Bikability Neighborhood Map, most of the neighborhoods in the region with the best access to bike routes are in Portland. The top 16 neighborhoods in the region, all with bikability scores of 5, are:
|
Neighborhood |
Location |
|---|---|
|
Alameda |
Portland |
|
Portland |
|
|
Alameda/Irvington |
Portland |
|
Ardenwald-Johnson Creek/Woodstock |
Portland |
|
Beaumont-Wilshire |
Portland |
|
Boise |
Portland |
|
Boise/Eliot |
Portland |
|
Eastmoreland/Ardenwald-Johnson Creek |
Portland |
|
Goose Hollow/Southwest Hills |
Portland |
|
Grant Park/Hollywood |
Portland |
|
Healy Heights/Southwest Hills |
Portland |
|
Homestead |
Portland |
|
Multnomah County Unclaimed #5 (north of Grant Park) |
Portland |
|
Sabin |
Portland |
|
Sabin/Irvington |
Portland |
|
Vernon |
Portland |
Among the top 50 most bikable neighborhoods in the region, only nine are not in Portland. These neighborhoods are:
|
Neighborhood |
Location |
Bikability |
|---|---|---|
|
Maywood Park |
Maywood Park |
4.98 |
|
Lewelling |
Milwaukie |
4.93 |
|
South Beaverton |
Beaverton |
4.91 |
|
Gresham-Hollybrook |
Gresham |
4.90 |
|
Greenway |
Beaverton |
4.90 |
|
Ardenwald-Johnson Creek |
Milwaukie and Portland |
4.68 |
|
Gresham-Northwest |
Gresham |
4.61 |
|
Gresham-City Central |
Gresham |
4.59 |
|
Southgate |
Milwaukie, Portland, & unincorporated Clackamas County |
4.51 |
While the maps provide a reasonably comprehensive measure of bikability, it is important to note that the data that underlie the bikability scores do not capture all of the elements that bicyclists consider when evaluating the bikability of a neighborhood. The maps use the following factors to determine whether a given route is suitable for biking: presence of bike lanes, traffic volume, traffic speed, and the presence of sharp curves and/or narrow lanes. The bikability of a route is classified using the following scheme
- Good for biking (bike lane, low traffic, low speed)
- Moderately suitable for biking (busy streets with bike lane and speeds generally greater than 25 mpg)
- Less suitable for biking (high traffic, speeds greater than 35 mpg, sharp curves and/or narrow lanes)
This classification scheme does not take into account street connectivity, which is essential when biking is used for commuting to work, running errands, or getting to specific destinations. It also does not incorporate data on hills, bike crash rates, presence of traffic lights or traffic calming devices, and other safety considerations beyond traffic speed. Unfortunately, creating a classification scheme that incorporates all of these factors was beyond the scope of this project. The bikability maps provide a good starting point, but any efforts to use the maps as the basis for planning or decision-making should factor in additional data as needed in order to create a more nuanced analysis of bikability in specific target areas.
About the Maps
Bikability Heatmap
This map is a density raster that shows suitability for biking based on Metro's "Bike There!" map designations. Cells in the raster were weighted based on the following suitability classifications:
- Good for Biking (bike lane, low traffic, low speed)
- Moderately Suitable for Biking (busy streets with bike lane and speeds generally greater than 25 mpg)
- Less Suitable for Biking (high traffic, speeds greater than 35 mpg, sharp curves and/or narrow lanes)
These data have some important limitations. First, connectivity is not taken into account, which results in the rating of curvilinear street patterns and highly connected grid networks as equally suitable for biking. Second, the street designations on the map were influenced by local interpretations that make it difficult to accurately compare one jurisdiction to another.
Data Source: Metro (2012)
Bikability Neighborhood Map
This map uses the same underlying data as the Bikability Heatmap, aggregated by neighborhood-level geography. The darker the neighborhood, the higher the bikability rating.
Data Source: Metro RLIS (2012)
*Some neighborhood boundaries overlap. The Atlas refers to the areas within the overlapping boundaries by the names of both neighborhoods.
|
This document was downloaded from the Map Series library of the Coalition for a Livable Future’s Regional Equity Atlas 2.0 website. The Regional Equity Atlas is a research and education project to promote widespread opportunity for a stronger, healthier, and more sustainable Portland-Vancouver metropolitan region. For more information, visit www.equityatlas.org. |
